Crypto/DXY ScoringHi!
This indicator "Crypto/DXY Scoring", a multi-purpose script, consists of various comparison statistics (including an alternative RS/RSMOM model) to show the strength of a currency against the DXY.
Features
"Contrived" RS/RSMOM alternative model
Compare the strength of the crypto currency on your chart to any asset (DXY default)
Glass's ∆
Z-comparison
Hedges' g
Cliff's Delta
Z-score for log returns
RRG graph (with adjusted dimensions) Traditional RRG graph coming soon (:
Let's go over some simplified interpretations of what's shown on the chart!
The image above provides generalized interpretations for the three of the data series plotted by the indicator.
The image above further explains the other plots for the indicator!
The image above shows the final result!
Underlying Theory
"When the dollar is strong as indicated by the DXY, it usually means that investors are seeking safety in traditional assets. Bitcoin (crypto) is often considered a "risk-on" asset, meaning investors might sell BTC in favor of holding dollars, thus driving BTC prices down."
Given the complexities associated with this relationship, including its contentious implications and a variable correlation between crypto and the DXY, this theory is one within a plethora.
That said, regardless of accuracy, this indicator adheres to the theory outlined above (:
The image above shows the purpose of the red/lime columns and the corresponding red/green lines.
Should the crypto on your chart and the DXY (or comparison symbol) exhibit negative correlation, and should the performance of DXY (or comparison symbol) hold any predictive utility for the subsequent performance of the crypto on your chart, the red columns violating the red line might indicate an upcoming "dump" for the crypto on your chart.
Lime green columns violating the green line may indicator an inverse response.
Alternative Relative Rotation Graph
In its current state, the alternated dimensions for the Relative Rotation Graph cause it to function more as a "Relative Performance Graph".
Fear not; a traditional RRG graph is coming soon!
The image above shows our alternative RRG!
Interpretation
With this model, you can quickly/intuitively assess the relative performance of the display cryptos against an index of their performance.
The image above shows generalized interpretations of the model!
That's it for this indicator! Thank you for checking it out; more to come (:
คริปโต

CE - 42MACRO Fixed Income and Macro This is Part 2 of 2 from the 42MACRO Recreation Series
However, there will be a bonus Indicator coming soon!
The CE - 42MACRO Fixed Income and Macro Table is a next level Macroeconomic and market analysis indicator.
It aims to provide a probabilistic insight into the market realized GRID Macro regimes,
track a multiplex of important Assets, Indices, Bonds and ETF's to derive extra market insights by showing the most important aggregates and their performance over multiple timeframes... and what that might mean for the whole market direction.
For traders and especially investors, the unique functionalities will be of high value.
Quick guide on how to use it:
docs.google.com
WARNING
By the nature of the macro regimes, the outcomes are more accurate over longer Chart Timeframes (Week to Months).
However, it is also a valuable tool to form an advanced,
market realized, short to medium term bias.
NOTE
This Indicator is intended to be used alongside the 1nd part "CE - 42MACRO Equity Factor"
for a more wholistic approach and higher accuracy.
Methodology:
The Equity Factor Table tracks specifically chosen Assets to identify their performance and add the combined performances together to visualize 42MACRO's GRID Equity Model.
For this it uses the below Assets:
Convertibles ( AMEX:CWB )
Leveraged Loans ( AMEX:BKLN )
High Yield Credit ( AMEX:HYG )
Preferreds ( NASDAQ:PFF )
Emerging Market US$ Bonds ( NASDAQ:EMB )
Long Bond ( NASDAQ:TLT )
5-10yr Treasurys ( NASDAQ:IEF )
5-10yr TIPS ( AMEX:TIP )
0-5yr TIPS ( AMEX:STIP )
EM Local Currency Bonds ( AMEX:EMLC )
BDCs ( AMEX:BIZD )
Barclays Agg ( AMEX:AGG )
Investment Grade Credit ( AMEX:LQD )
MBS ( NASDAQ:MBB )
1-3yr Treasurys ( NASDAQ:SHY )
Bitcoin ( AMEX:BITO )
Industrial Metals ( AMEX:DBB )
Commodities ( AMEX:DBC )
Gold ( AMEX:GLD )
Equity Volatility ( AMEX:VIXM )
Interest Rate Volatility ( AMEX:PFIX )
Energy ( AMEX:USO )
Precious Metals ( AMEX:DBP )
Agriculture ( AMEX:DBA )
US Dollar ( AMEX:UUP )
Inverse US Dollar ( AMEX:UDN )
Functionalities:
Fixed Income and Macro Table
Shows relative market Asset performance
Comes with different Calculation options like RoC,
Sharpe ratio, Sortino ratio, Omega ratio and Normalization
Allows for advanced market (health) performance
Provides the calculated, realized GRID market regimes
Informs about "Risk ON" and "Risk OFF" market states
Visuals - for your best experience only use one (+ BarColoring) at a time:
You can visualize all important metrics:
- GRID regimes of the currently chosen calculation type
- Risk On/Risk Off with background colouring and additional +1/-1 values
- a smoother GRID model
- a smoother Risk On/ Risk Off metric
- Barcoloring for enabled metric of the above
If you have more suggestions, please write me
Fixed Income and Macro:
The visualisation of the relative performance of the different assets provides valuable information about the current market environment and the actual market performance.
It furthermore makes it possible to obtain a deeper understanding of how the interconnected market works and makes it simple to identify the actual market direction,
thus also providing all the information to derive overall market health, market strength or weakness.
Utility:
The Fixed Income and Macro Table is divided in 4 Columns which are the GRID regimes:
Economic Growth:
Goldilocks
Reflation
Economic Contraction:
Inflation
Deflation
Top 5 Fixed Income/ Macro Factors:
Are the values green for a specific Column?
If so then the market reflects the corresponding GRID behavior.
Bottom 5 Fixed Income/ Macro Factors:
Are the values red for a specific Column?
If so then the market reflects the corresponding GRID behavior.
So if we have Goldilocks as current regime we would see green values in the Top 5 Goldilocks Cells and red values in the Bottom 5 Goldilocks Cells.
You will find that Reflation will look similar, as it is also a sign of Economic Growth.
Same is the case for the two Contraction regimes.
******
This Indicator again is based to a majority on 42MACRO's models.
I only brought them into TV and added things on top of it.
If you have questions or need a more in-depth guide DM me.
GM

CE - 42MACRO Equity Factor Table This is Part 1 of 2 from the 42MACRO Recreation Series
The CE - 42MACRO Equity Factor Table is a whole toolbox packaged in a single indicator.
It aims to provide a probabilistic insight into the market realized GRID Macro Regime, use a multiplex of important Assets and Indices to form a high probability Implied Correlation expectation and allows to derive extra market insights by showing the most important aggregates and their performance over multiple timeframes... and what that might mean for the whole market direction, as well as the underlying asset.
WARNING
By the nature of the macro regimes, the outcomes are more accurate over longer Chart Timeframes (Week to Months).
However, it is also a valuable tool to form a proper,
market realized, short to medium term bias.
NOTE
This Indicator is intended to be used alongside the 2nd part "CE - 42MACRO Yield and Macro"
for a more wholistic approach and higher accuracy.
Due to coding limitations they can not be merged into one Indicator.
Methodology:
The Equity Factor Table tracks specifically chosen Assets to identify their performance and add the combined performances together to visualize 42MACRO's GRID Equity Model.
For this it uses the below Assets, with more to come:
Dividend Compounders ( AMEX:SPHD )
Mid Caps ( AMEX:VO )
Emerging Markets ( AMEX:EEM )
Small Caps ( AMEX:IWM )
Mega Cap Growth ( NASDAQ:QQQ )
Brazil ( AMEX:EWZ )
United Kingdom ( AMEX:EWU )
Growth ( AMEX:IWF )
United States ( AMEX:SPY )
Japan ( AMEX:DXJ )
Momentum ( AMEX:MTUM )
China ( AMEX:FXI )
Low Beta ( AMEX:SPLV )
International ex-US ( NASDAQ:ACWX )
India ( AMEX:INDA )
Eurozone ( AMEX:EZU )
Quality ( AMEX:QUAL )
Size ( AMEX:OEF )
Functionalities:
1. Correlations
Takes a measure of Cross Market Correlations
2. Implied Trend
Calculates the trend for each Asset and uses the Correlation to obtain the Implied Trend for the underlying Asset
There are multiple functionalities to enhance Signal Speed and precision...
Reading a signal only over a certain threshold, otherwise being colored in gray to signal noise or unclear market behavior
Normalization of Signal
Double Normalization of Signal for more Speed... ideal for the Crypto Market
Using an additional Hull Moving Average to enhance Signal Speed
Additional simple Background coloring to get a Signal from the HMA
Barcoloring based on the Implied Correlation
3. Equity Factor Table
Shows market realized Asset performance
Provides the approximate realized GRID market regimes
Informs about "Risk ON" and "Risk OFF" market states
Now into the juicy stuff...
Visuals:
There is a variety of options to change visual settings of what is plotted and where
+ additional considerations.
Everything that is relevant in the underlying logic which can improve comprehension can be visualized with these options.
More to come
Market Correlation:
The Market Correlation Table takes the Correlation of all the Assets to the Asset on the Chart,
it furthermore uses the Normalized KAMA Oscillator by IkkeOmar to analyse the current trend of every single Asset.
(To enhance the Signal you can apply the mentioned Indicator on the relevant Assets to find your target Asset movements that you intend to capture...
and then change the length of the Indicator in here)
It then Implies a Correlation based on the Trend and the Correlation to give a probabilistically adjusted expectation for the future Chart Asset Movement.
This is strengthened by taking the average of all Implied Trends.
Thus the Correlation Table provides valuable insights about probabilistically likely Movement of the Asset over the defined time duration,
providing alpha for Traders and Investors alike.
Equity Factors:
The table provides valuable information about the current market environment (whether it's risk on or risk off),
the rough GRID models from 42MACRO and the actual market performance.
This allows you to obtain a deeper understanding of how the market works and makes it simple to identify the actual market direction,
makes it possible to derive overall market Health and shows market strength or weakness.
Utility:
The Equity Factor Table is divided in 4 Sections which are the GRID regimes:
Economic Growth:
Goldilocks
Reflation
Economic Contraction:
Inflation
Deflation
Top 5 Equity Factors:
Are the values green for a specific Column?
If so then the market reflects the corresponding GRID behavior.
Bottom 5 Equity Factors:
Are the values red for a specific Column?
If so then the market reflects the corresponding GRID behavior.
So if we have Goldilocks as current regime we would see green values in the Top 5 Goldilocks Cells and red values in the Bottom 5 Goldilocks Cells.
You will find that Reflation will look similar, as it is also a sign of Economic Growth.
Same is the case for the two Contraction regimes.
This whole Indicator, as well as the second part, is based to a majority on 42MACRO's models.
I only brought them into TV and added things on top of it.
If you have questions or need a more in-depth guide DM me.
Will make a guide to all functionalities if necessity becomes apparent.
GM

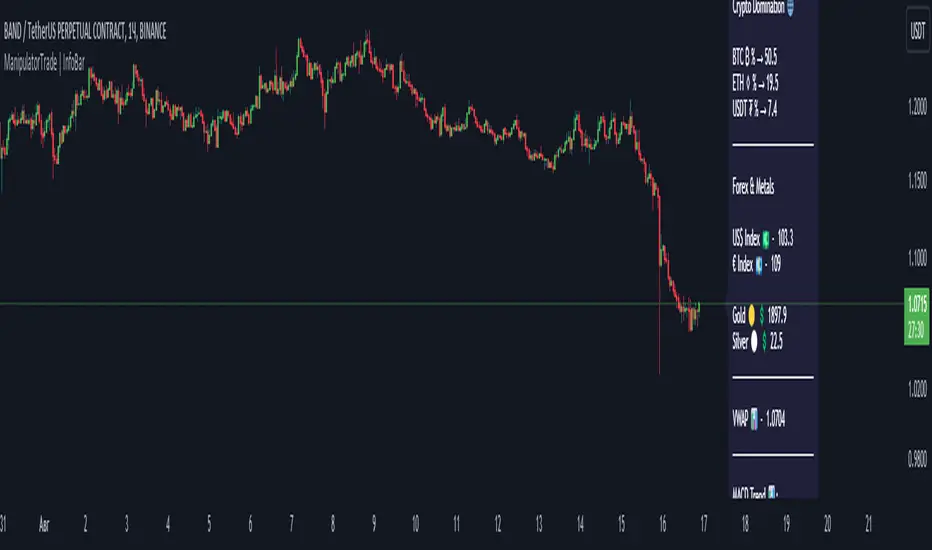
ManipulatorTrade | InfoBarEnglish
With this indicator, you can track the instrument selected in the settings, there is also RSI, MACD, Stochastic. The InfoBar will show you overbought or oversold, as well as the trend in MACD.
You can track crypto dominance: BTC, ETH, USDT.
Also keep an eye on indices and metals.
There is VWAP which shows the average price weighted by volume over a certain period. All settings can be changed.
Українська
За допомогою даного індикатора ви можете відстежувати інструмент вибраний в налаштуваннях, так само є RSI, MACD, Stochastic. InfoBar вам покаже перекупленність або перепроданість, так само тренд в MACD.
Ви можете відстежувати крипто домінацію: BTC, ETH, USDT.
Так само слідкувати за індексами та металами.
Є VWAP, який показує середню ціну, виважену за обсягом за певний період. Усі налаштування можна змінити.
Русский
С помощью данного индикатора вы можете отслеживать инструмент выбранный в настройках, так же есть RSI, MACD, Stochastic. InfoBar вам покажет перекупленностть или перепроданность, так же тренд в MACD.
Вы можете отслеживать крипто доминацию: BTC, ETH, USDT.
Так же следить за индексами и металлами.
Есть VWAP который показывает среднюю цену, взвешенную по объему за определенный период. Все настройки можно изменить.
Market Sessions and TPO (+Forecast)This indicator "Market Sessions and TPO (+Forecast)" shows various market sessions alongside a TPO profile (presented as the traditional lettering system or as bars) and price forecast for the duration of the session.
Additionally, numerous statistics for the session are shown.
Features
Session open and close times presented in boxes
Session pre market and post market shown
TPO profile generated for each session (normal market hours only)
A forecast for the remained of the session is projected forward
Forecast can be augmented by ATR
Naked POCs remain on the chart until violated
Volume delta for the session shown
OI Change for the session shown (Binance sourced)
Total volume for the session shown
Price range for the session shown
The image above shows processes of the indicator.
Volume delta, OI change, total volume and session range are calculated and presented for each session.
Additionally, a TPO profile for the most recent session is shown, and a forecast for the remainder of the active session is shown.
The image above shows an alternative display method for the session forecast and TPO profile!
Additionally, the pre-market and post-market times are denoted by dashed boxes.
The image above exemplifies additional capabilities.
That's all for now; further updates to come and thank you for checking this out!
And a special thank you to @TradingView of course, for making all of this possible!

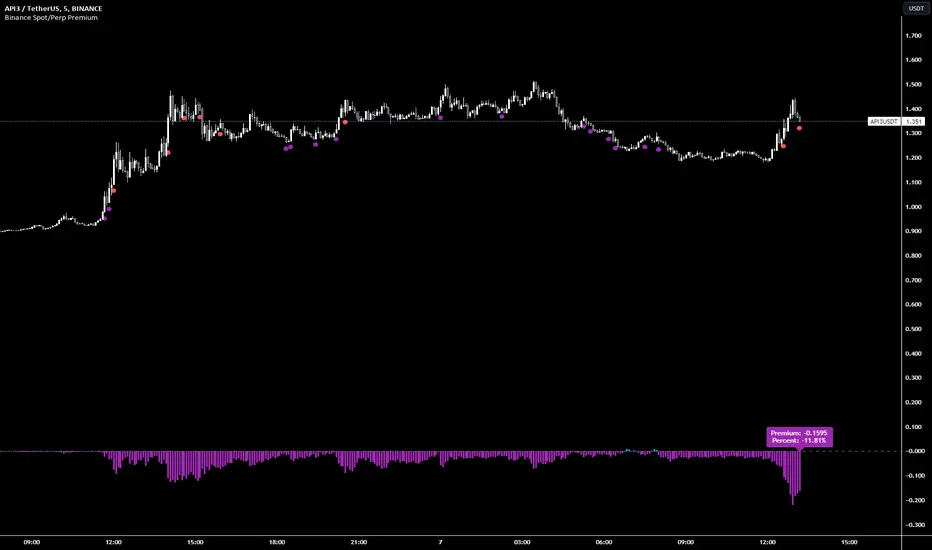
Binance Spot/Perp Premium | PCPR1NCIPALBinance Spot/Perp Premium Indicator
This indicator visually shows the price difference (called "Premium") between the perpetual contract and the spot market of a particular cryptocurrency on Binance.
Histogram: Displays the premium amount. Positive values are shown in blue and negative values in purple.
Blue Circle: Appears below the bar when the premium goes over 1% and there hasn't been a purple circle in the past 90 minutes.
Purple Circle: Appears below the bar when the premium drops below -1% and there hasn't been a blue circle in the past 90 minutes.
Green Circle: Shows up below the bar when the premium exceeds 5%. A new circle can appear every 15 minutes if the condition is met.
Red Circle: Appears below the bar when the premium drops more than -5%. After a red circle, there's a 30-minute cooldown before another can appear.
A label at the bottom displays the current premium amount and its percentage, helping users quickly gauge the market situation.
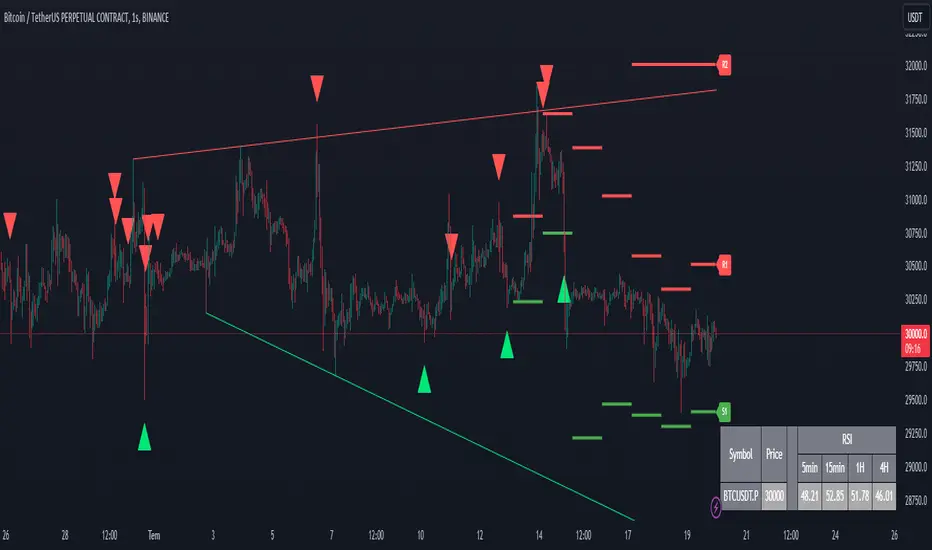
CoinFxPro Range indicator V 1.0This indicator has a structure that combines daily and weekly pivot levels, moving averages, and strength index-linked oscillators. The purpose of the indicator is designed to analyze price movements and identify potential trend reversals. Daily pivot levels are helpful in identifying critical support and resistance zones, while moving averages and oscillators indicate overbought or oversold situations in the price.
It is very simple to use and simple in appearance.
Triangular Signals appearing on the chart screen come when the price touches the daily or weekly support and resistance levels.
If you want the signals to be received less or more healthy, I added the filtering feature. In this way, you can filter the incoming signals through the volume or volatility filter, so that less signals are received.
On the other hand, the 4 timeframe rsi values of the price for daily use of the indicator are also given in the table.
You can change the RSI timeframes as you wish.
In this way, it is seen more clearly whether the signal is healthy and provides convenience while trading.
Evaluation of incoming signals;
First of all, when the signal occurs, pay attention to whether the RSI values that occur in the timeframe you trade and in other timeframes are overbought (red) or oversold (green).
When the signal comes, I buy or sell, especially if the RSI values in the 5 minutes, 15 minutes and 1 hour time periods are overbought or oversold.
If you wish, you can try a different strategy for yourself.
After the healthiest of the signals on the chart comes, the RSI values are also at overbought or oversold levels in 5-15 minutes and 1 hour timeframes and if there is a Trendline line above or below the price, it is out of that region.
A healthy buying or selling transaction can be made.
It should be noted that since risk = return, high risk means high return. High risk must be taken for high returns. Therefore, I recommend that you do not exceed 10% of your capital as margin when trading with leverage.
When trading, I always recommend trading with additional confirmation from a different indicator.
I also added a filtering feature to the indicator to block market structure related variables. Those who want to use can also use filtering.
I have added the automatic trendline for ease of trading. You can increase or decrease the number of trend lines as you wish.
I just published the indicator for daily use.
@tk · fractal rsi levels█ OVERVIEW
This script is an indicator that helps traders to identify the RSI Levels for multiple fractals wherever the current timeframe is. This script was based on RSI Levels, 20-30 & 70-80 by abdomi indicator, that calculates the Relative Strenght Index levels based on the asset's price and plots it into the chart, creating a "wave" style indicator. The core feature of this indicator is the fractal rays, so trader can visualize each of the oversold and overbought levels of multiple timeframe on the current timeframe that he is on. The indicator will plots multiple rays after the chart bars. indicating where is the oversold and overbought levels for others fractals.
█ MOTIVATION
Since the RSI Levels, 20-30 & 70-80 by abdomi indicator helps a lot to identify the possible price levels when the asset is oversold or overbought, I saw myself drawing multiple horizontal lines on these levels in lower timeframes so, in an uptrend or downtrend, I can try to get a pullback of these trends when the asset reaches oversold or overboght levels. So, I get the idea to make those lines visible in multiple timeframes so I don't need to draw it myself manually anymore.
█ CONCEPT
The trading concept to use this indicator is the concept to make entries on uptrend or downtrend pullbacks when the asset price reaches oversold or overbought levels. But this strategy don't works alone. It needs to be aligned together with others indicators like Exponential Moving Averages, Chart Patterns, Support and Resistance, and so on... Even more confluences that you have, bigger are your chances to increase the probability for a successful trade. So, don't use this indicator alone. Compose a trading strategy and use it to improve your analysis.
█ CUSTOMIZATION
This indicator allows the trader to customize the following settings:
GENERAL
Text size
Changes the font size of the labels to improve accessibility.
Type: string
Options: `tiny`, `small`, `normal`, `large`.
Default: `small`
RSI LEVELS · SETTINGS
Pre-oversold Level
Changes the RSI Level to calculate the "pre-oversold" price level on the chart.
Type: int
Min: 1
Max: 49
Default: 33
Pre-overbought Level
Changes the RSI Level to calculate the "pre-overbought" price level on the chart.
Type: int
Min: 51
Max: 100
Default: 67
Show "Pre-over" Levels
Enables / Disables the pre-oversold and pre-overbought levels on the chart.
Type: bool
Default: true
FRACTAL RAYS · SETTINGS
Length
Changes the base length for the RSI calculation.
Type: int
Min: 1
Default: 14
Source
Changes the base source for the RSI calculation.
Type: float
Default: close
FRACTAL RAYS · STYLE
Ray Color
Changes the color of all fractal rays and its label.
Type: color
Default: color.rgb(187, 74, 207)
Ray Style
Changes the style of all fractal rays.
Type: string
Options: `line.style_solid`, `line.style_dashed`, `line.style_dotted`
Default: line.style_dotted
Ray Length
Changes the length of all fractal rays.
Type: int
Default: 15
FRACTAL RAYS · OVERSOLD
Oversold Level
Changes the base RSI Level for fractal rays calculation.
Type: int
Min: 1
Default: 30
Oversold Prefix
Customizes the fractal ray label with a prefix text.
Type: string
Default: 🚀
Oversold Suffix
Customizes the fractal ray label with a suffix text.
Type: string
Default: (empty)
FRACTAL RAYS · OVERBOUGHT
Overbought Level
Changes the base RSI Level for fractal rays calculation.
Type: int
Min: 1
Default: 70
Overbought Prefix
Customizes the fractal ray label with a prefix text.
Type: string
Default: 🐻
Overbought Suffix
Customizes the fractal ray label with a suffix text.
Type: string
Default: (empty)
FRACTAL RAYS · VISIBILITY RULES
These rules are applied for each of fractal rays so, the traders can choose what timeframes they wants to show the fractal rays for each of it. The rule will be applied as the following condition: `if timeframe != CURRENT_TIMEFRAME and timeframe <= CHOSEN_OPTION`. Actually, the fractal rays are on the chart but, isn't visible because it was applied a transparent color, so it is visually not on the chart to prevent chart's over polution.
LABELS
Show Labels on Price Scale
Shows labels on price scale.
Type: bool
Default: false
Show Price on Fractal Rays
Shows the RSI Level price on each of fractal rays respectively.
Type: bool
Default: false
█ EXTERNAL LIBRARIES
This script uses the `tk` library to calculate RSI Levels. It is a library that contains various functions that helps pine script developers to calculate RSI Levels.
█ FUNCTIONS
The library contains the following functions:
fn_fractalVisibilityRule(string visibilityRule)
Converts the fractal rays timeframe visibility rule label to timestamp int.
Parameters:
visibilityRule: (string) Fractal ray visibility rule label.
Returns: (int) Fractal ray visibility rule timestamp.
fn_requestFractal(string period, expression)
Converts the fractal rays timeframe visibility rule label to timestamp int.
Parameters:
period: (string) Timeframe period for the desired fractal.
expression: (mixed) Security expression that will be applied for calculation.
Returns: (mixed) A result determined by expression.
fn_plotRay(float y, string label, color color, int length)
Plots ray after chart bars for the current time.
Parameters:
period: (string) Timeframe period for the desired fractal.
expression: (mixed) Security expression that will be applied for calculation.
Returns: (void) This function only plots the elements into the chart
fn_plotRsiLevelRay(simple string period, simple int level, color color)
Plots RSI Levels ray after chart bars for the current time.
Parameters:
period: (simple string) Timeframe period.
level: (simple int) Relative Strength Index level.
color: (color) The color of both, ray and label text.
Returns: (void) This function only plots the elements into the chart

EMAflowPRO -Ranges-DISCLAIMER: Always, please keep in mind that market conditions change, past results cannot guarantee the same results in the future.
EMAflowPRO - Ranges-
EMAflowPRO ranges indicator will detect key movements in the market that fit certain conditions and based on that create key tradable zones by providing dynamic and static range levels.
Before reading further please take a look at the indicator values names on the right in the main chart above - these names are linked to the content below when we talk about range structure. The examples included in charts are linked to the area we're discussing (if something was said - most likely closest chart demonstrates it - Also arrows present entries; can be limit or can be market buy/sell in to the wicks.)
Let's find out what indicator does...
Static range logic:
Indicator uses combination of market timing indicators (counting relationship between candles) , fisher transform, stoch rsi, bollinger bands to detect important market price action that show strenght - based on that it will project a static range where key goal is to predict where market will be extremely oversold, extremely overbought or where market could change bias etc.
The setups it provides are very similar to those that come out of harmonic patterns - but it was developed with unique approach without knowing what harmonic patterns are.. so it's not completly the same.
Range is represented by 3 tradable areas (actual trade ideas on charts - arrow points towards a level - on the right there is a scale with a number- limit order can be placed there )
Top of the range - It serves as a shorting area or if top is converted to support can also signal a potential breakout or start of new trend.
Example of a short the top of the range:
29732 - is area where wicks can be sold in to , or limit sell is placed - with higher leverage sl should be tight, with lower sell orders can be spread out up to the middle with sl just above 30500, targets can be choosen based on the provious range top as % moves point.
Example of longing the levels on the recent rise - price staying above middle of the top of the range keeps bias on the upside and potentially signals a break out or start of new trend
Uppper, Middle, Lower part of the range: Sideway area - middle of the range decides direction , above favors the upper levels , below favors the lower levels.
Very nice example where white line is middle of the range and shows that even in strong trend - range projection is able to accurately predict key pullback areas that provide substantial gain. See image below - again settign limit orders where middle of the range is allows you to get a comfortable entry with very big risk reward ratio.
Bottom of the range - market is extremely oversold
Spx example of our recent range from last year's summer - again chart includes both EMAflow indicator and EMAflow ranges as all indicators are extremely complementary and present two sides of the medal sideway and trend view.
Chart only contains ranges but shows the same pair and time:
If price goes below middle of the bottom of the range it could signal a break down or start of new bearish trend.
Dynamic range logic
Since sometimes static range gets broken out or is not respected and the price action is not yet sufficient to generated a new one we included a dynamic supply demand part where dynamic range is generated working in a similar way but does add clarity when static range fails.
example of this can be seen when ftx caused a btc dump we broke through the bottom of the range but dynamic range later showed us new bottom we could trade.
Confluence between both can also provide even more sure levels to place limit orders or to market buy or sell when wicks in to that area occurs.
Minuses:
Since ranges tend to work best when market is sideway - a second part is recommended with EMAflowPRO where focus on moving averages helps you navigate stronger trends.
Not all tfs are well synced with ranges on various assets so you will need to flip through few ones to find the best timeframes that historically worked the best - if you come across an asset that doens't look good you should just change timeframe to higher until you see something that fits or change asset until you get something that looks clear.
Settings:
EMAflow - Ranges - allows you to preset minimum potential of a trade setup you want to look for - default is 6% that ensures you can get a good setup on lower and higher tfs.

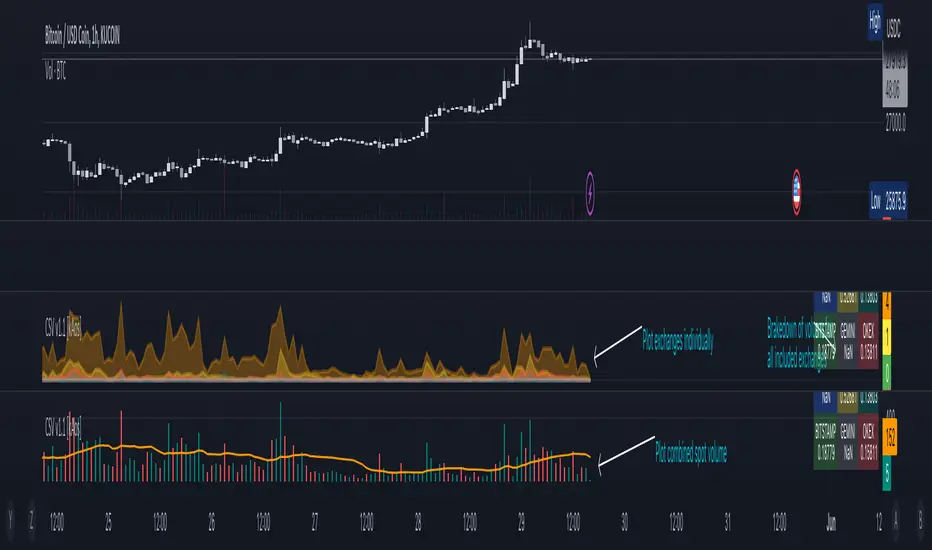
Combined Spot Volume | Crypto v1.1 [kAos]This script combines the "ticker volume" from 9 different exchanges. The default settings are for Crypto Assets only. In the settings window you can choose to plot the "combined volume" in a histogram form or "individual exchange volume" in an area view. (as shown on the chart) Addition to the plots there is also an Info Table in the bottom right corner that brakes down the volume to individual exchanges, shows how much volume was traded on which exchange. If the Table shows "NaN" on an exchange you need to check the spelling of that exchange, if thats correct, than the ticker is not available on that exchange.
Option ScalperWhat is Scalping?
Scalping is a trading strategy aimed at profiting from quick momentum in a volatile index or stock or any other instrument that can be traded.
Traders who use such strategies place anywhere from 10 to a few hundred trades in a single day.
The idea behind such type of trading is that small moves in an index or stock price are much easier to capture than the larger moves.
Traders who use such strategies are known as scalpers. When you take many small profits a number of times, say 10 points scalped 20 times per day, they can easily add up to large gains.
An Option Buyer's Biggest Enemy is Time Decay and when you scalp, you do not allow the time decay to eat your Option Premium as your Entry and Exit is often quick enough.
What is Option Scalper?
Option Scalper indicator is a momentum-based indicator that tries to detect momentum based upon a number of factors as given below:
(1) Price action accumulated over a period of time when big candles are nowhere
(2) Repeatedly Occurring, certain Candle patterns which indicate if buyers have the upper hand or sellers are ruling the market.
(3) Gradient of moving averages which shows consistency of net buying/selling force
(4) Price jumping normal distribution line and landing in outlying areas, signalling increasing momentum of buying/selling activity.
Based upon the above factors, when Option Scalper thinks a move has the potential to turn into a big move, it generates its Buy/Sell Signals.
When aggressive buying or selling starts where Buying & Selling Forces become unequal, the Price starts moving in one direction with candles making Higher Highs or Lower Lows, moving average lines start scaling up or down or volumes start increasing.
Option Scalper detects these (1) Higher Highs or Lower Lows, (2) scaling up moving average lines, and/or (3) price breaking out of channels; and generates Buy or Sell signals.
In order to use this indicator, simply deploy this on your chart, and wait for Buy/Sell signals. When a Buy/Sell Signal appears, a small line starts forming up at the closing level of Buy/Sell signal candle. Your Entry will be above that line for Buy Signal and below that line for Sell Signal.
It works on all time frames.
Whenever a Buy Signal is followed by Sell signal (let it be after 7 - 8 candles or after many candles) or vice-versa, you have to switch your position to make most of the reverse move.
It is a general purpose indicator and may be used on stocks, commodities, forex and any other instruments alike and is not meant for any specific market.
How to Take Buy/Sell Entry with Option Scalper?
Whenever a Buy/Sell Signal appears on a candle, Option Scalper starts marking its closing price with a horizontal line that keeps extending towards right side with every new candle. This line is Blue in Color for Buy Signal and dark golden color for Sell Signal.
Initially this horizontal line will be very small but as more and more candles appear with the passage of time, the length of the line keeps increasing.
The purpose of this line is to mark the closing price of Signal candle and you have to take your Buy Entry above this line (if last signal is BUY) or you have to take your trade Below this line (if last signal is SELL).
The indicator will also draw another line at the Opening Price of Signal Candle, which can act as your initial stop loss. If trade starts moving in your direction and price goes above upper variance line (light green curvy line) or goes below lower variance line (purple wavy line), then that line becomes your trailing stop loss line from that point onwards.
The indicator also marks the consolidation zone for you. If the Buy/Sell Signal has come but price is in consolidation zone (grey colour cloud), do not take any positions yet and wait for the price to come out of the cloud and breach the Entry Line.
Exiting Buy/Sell Positions and Re-Entry Rules
1. Exiting your Buy Trade: When a Buy Trade is active, indicator can detect where the ongoing upmove may end or retrace for a while and it will print an X symbol (RED COLOR) to warn you. After you see a Red Color X symbol, if price starts making lower lows, you can exit your Buy Trade there or if you are in good profit, you can wait for the price to go below upper variance line (the green color Trailing Stop Loss Line for Buy Trade). See the image below for Red Color X symbol which warns you to be prepared for EXIT from Buy Trade:
2. Re-Entry for Buy Trade: If the last signal on your chart is still Buy Signal but your stop loss has been hit once or twice and you have no open positions now, you can RE-ENTER in buy trade if and when price again climbs above the grey cloud.
3. Exiting your Sell Trade: When a Sell Trade is active, indicator can detect where the ongoing down-move may end or retrace for a while and it will print an X symbol (Green COLOR) to warn you. After you see a Green Color X symbol, if price starts making higher highs, you can exit your Sell Trade there or if you are in good profit, you can wait for the price to go above lower variance line (the purple color Trailing Stop Loss Line for Sell Trade).
4. Re-Entry for Sell Trade: If the last signal on your chart is Sell Signal but your stop loss has been hit once or twice and you have no open positions now, you can RE-ENTER in Sell trade if and when price again crosses below the grey color cloud.
See the image below for recognizing Red and Green X symbols which indicate that temporary retracement or reversal signal is developing:
What are the other features of Option Scalper?
1. End to End Horizontal Support/Resistance Lines: Indicator also detects, prints and deletes horizontal support and resistance lines which can help in your trading decisions. For example, a Buy Signal comes and price crosses above upper variance line and also crosses nearby horizontal resistance line means it has higher probability of moving further up. The reverse is also true (for Sell Signal). See an example of a resistance line below:
2. Star Symbols: If 5 or more consecutive candles are of the same color, then Star Symbol (*) starts appearing above or below the candles. When price has moved too high or too low from the upper or lower variance line, these stars indicate that there is higher probability of retracement happening now which should prompt you to book full or partial profit. See the circled stars in the below image
3. Color Changing Candles: If a candle changes its color from Red to Purple or from Green to light green, they indicate increased intensity of Selling or Buying activity. For example, if each 1 min candle within a 5 min candle is red, then that 5 min candle will turn purple which means Selling pressure is too much and there are very few or no buyers at all. Reverse is also true when Green Candle becomes Light Green. Example images of such candles can be seen below:
4. Consolidation Zone: It is very important for an option buyer to strike only when there is momentum and not to take any fresh trade (or if you already have a position, then closing it for the time being) when price is in consolidation zone. Consolidation zone is marked by a grey colour cloud as seen in below image.
What Type of Alerts Can be Set up: You can set up 3 type of alerts with this indicator (a) Buy Entry Signal which happens when Price closes above the marked Buy Price Level (b) Sell Signal which happens when Price closes below the marked Sell Price Level or (c) Any signal (if you want to be alerted when either Buy or Sell Signal happens)
How to get this indicator?
This is invite-only indicator. Get in touch with us using information given below in Signature field to try this indicator FREE. You may also chat with us through Private Chat feature of TradingView.

Fierytrading: Volatility DepthDear Tradingview community,
I'd like to share one of my staple indicators with you. The volatility depth indicator calculates the volatility over a 7-day period and plots it on your chart.
This indicator only works for the DAILY chart on BTC/USD.
Colors
I've color coded the indicator as follows:
- Red: Extreme Volatility
- Orange: High Volatility
- Yellow: Normal Volatility
- Green: Low Volatility
Red: extreme changes in price. Often during local tops and bottoms.
Orange: higher than average moves in price. Often before or after a "red" period. Often seen in the middle of bear or bull markets.
Yellow: normal price action. Often seen during early stage bull-markets and late stage bear-markets.
Green: very low price movement. Often during times of indecision. Once this indicator becomes green, you can expect a big move in either direction. Low volatility is always followed by high volatility.
In a long-term uptrend, a green period often signals a bullish break out. In a long-term downtrend it often signals a bearish break out.
How to use
Save the indicator and apply it to your chart. You can change the length in the settings, but it's optimized for 7 days, so no need to change it.
I've build in alerts for all 4 different volatility periods. In most cases, the low volatility alert is enough.
Good luck!

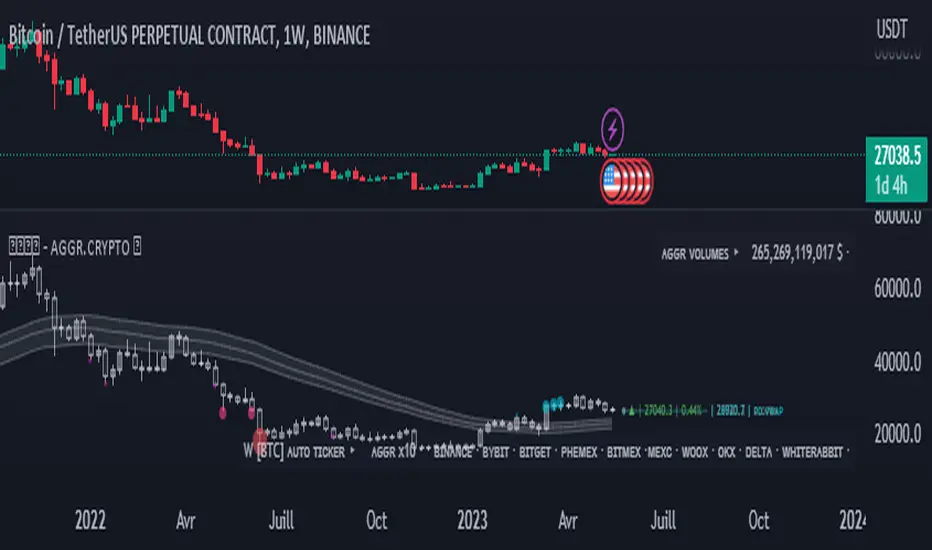
Opal - Aggr.Crypto█ OVERVIEW
The Multi-Exchange Crypto Aggregator is a unique concept ticker that gathers up to 10 tickers into one. A new OPAL Chart is created as an indicator, with its own candles and information. This information is meant to be interpreted as average information in order to reduce noise from a single ticker only. Everything is automated between assets. Our script will always check and ensure that data is received for calculations; otherwise, invalid tickers are ignored. This version is designed for Crypto Perpetual markets.
█ HOW DATA SLIPPAGE/DIFFERENCE IMPACT NOISE
This new average ticker aims to reduce noise in your candles and their live movements, avoiding most of the minor/last-second spikes, especially when they don't happen on every desired exchange at the same time. Our candles have different behaviors and highlight close-open slippage/gaps, as it seems to provide a strong reaction. Those gaps represent average slippage.
█ HOW TO USE
This should help you visualize market behaviors. Volume pressures are the origin of a lot of misunderstood things. Data analysis and observations show that makers target liquidity on both sides. Time and sessions have their own logic and will always need experience, as it is basically a gigantic Tetris game. Anyway, this should help with timing confirmations or bring confidence.
█ FEATURES
Aggregated (Tickers) Candles ▸ Aggregated OHLC candles, the idea behind the script. Set desired tickers to automate in settings. Value and Var% are displayed right next to the current candle.
Aggr. Dynamics/Levels ▸ Plot some strong levels as landmarks calculated on modified price, from Volume Weighted Average Price (VWAP) to Daily aggregated Open Price. The previous day's key level is included.
Aggr. Data Markers ▸ Plot some key markers on the chart, such as Open Pressure gaps, or estimated 3-scale liquidation bubbles with 2 confirmation modes (using different filters).
Aggr. Averages ▸ Plot up to 3 averages or HLC channels for visual ease.
█ SIGN
All of our contents are shared for educational purposes only.
Wishing you success;
OPAL - Strive for Greatness
Crypto Trend IndicatorThe Crypto Trend Indicator is a trend-following indicator specifically designed to identify bullish and bearish trends in the price of Bitcoin, and other cryptocurrencies. This indicator doesn't provide explicit instructions on when to buy or sell, but rather offers an understanding of whether the trend is bullish or bearish. It's important to note that this indicator is only useful for trend trading.
The band is a visual representation of the 30-day and 60-day Exponential Moving Average (EMA). When the 30-day EMA is above the 60-day EMA, the trend is bullish and the band is green. When the 30-day EMA is below the 60-day EMA, the trend is bearish and the band is red. When the 30-day EMA starts to converge with the 60-day EMA, the trend is neutral and the band is grey.
The line is a visual representation of the 20-week Simple Moving Average (SMA) in the daily timeframe. "Bull" and "Bear" signals are generated when the 20-day EMA is either above or below the 20-week SMA, in conjunction with a bullish or bearish trend. When the band is green and the 20-day EMA is above the 20-week SMA, a “Bull” signal emerges. When the band is red and the 20-day EMA is below the 20-week SMA, a “Bear” signal emerges. The 20-week SMA can potentially also function as a leading indicator, as substantial price deviations from the SMA typically indicate an overextended market.
While this indicator has traditionally identified bullish and bearish trends in various cryptocurrency assets, past performance does not guarantee future results. Therefore, it is advisable to supplement this indicator with other technical tools. For instance, range-bound indicators can greatly improve the decision-making process when planning for entries and exits points.

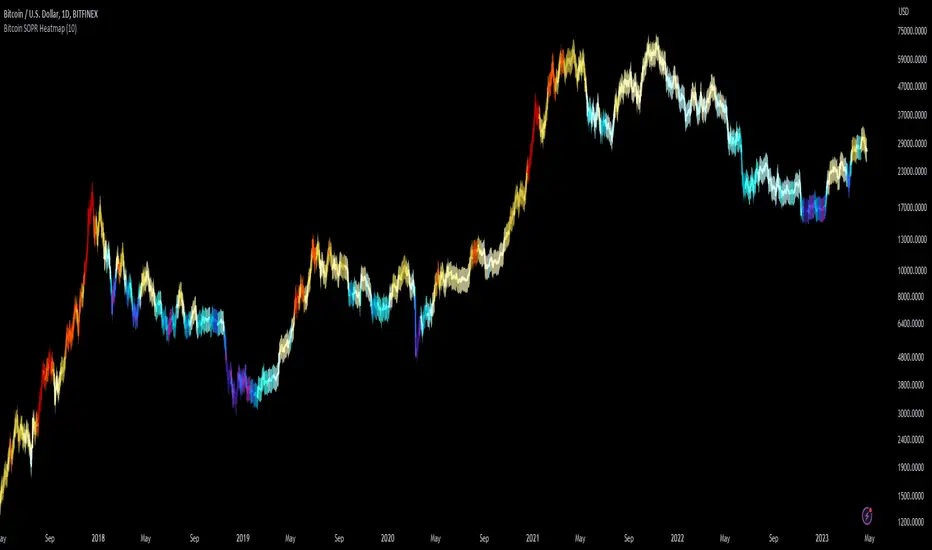
Bitcoin SOPR HeatmapSOPR (spent output profit ratio) is a metric, provided by Glassnode to measure if most BTC are moved in profit or in loss. The higher SOPR is, the more profits are realized (theoretically) and vice versa.
This indicator shows SOPR visually as a heatmap directly on the Bitcoin chart.
Cold temperatures (blue, purple) show bear markets. Bear market peaks should be visible in dark purple.
Hot temperatues (yellow, red) show bull markets. Hype phases should be visible in red.
I recommend to hide chart when using the indicator. Otherwise you can also enlarge the heatmap in the settings.
The indicator works best on BTCUSD standard charts on daily timeframe. Otherwise you will see an error message.
Net Positions (Net Longs & Net Shorts) - By LeviathanThis script is an experimental indicator that visualizes the entering and exiting of long and short positions in the market. It also includes other useful tools, such as NL/NS Profile, NL/NS Delta, NL/NS Ratio, Volume Heatmap, Divergence finder, Relative Strength Index of Net Longs and Net Shorts, EMAs and VWMAs and more.
To avoid misinterpretation, it's important to understand some basics. The “real” ratio between net long and net short positions in a given market is always 1:1. A futures contract is an agreement between two parties to buy or sell an underlying asset at an agreed-upon price. Each contract has a long side and a short side, with one party agreeing to buy (long) and the other party agreeing to sell (short) the asset at the agreed-upon price. The long position holder anticipates that the asset's price will rise, while the short position holder expects it to fall. Because every futures contract involves both a buyer and a seller, it is impossible to have more net longs than net shorts or vice versa (in terms of the net value). For every long position opened, there must be a corresponding short position taken by another market participant (and vice versa), thus maintaining the 1:1 ratio between longs and shorts. While there can be an imbalance in the number of traders/accounts holding long and short contracts, the net value of positions held on each side remains 1 to 1.
Open Interest (OI) is a metric that tracks the number of open (unsettled) contracts in a given market. For example, Open Interest of 100 BTC means that there are currently 100 BTC worth of longs and 100 BTC worth of shorts open in the market. There may be more traders on one side holding smaller positions, and fewer traders on the other side holding larger positions, but the net value of positions on one side is equal to the net value of positions on the other side → 100 BTC in longs and 100 BTC in shorts (1:1). Consider a scenario in which a trader decides to open a long position for 1 BTC at a price of HKEX:30 ,000. For this long order to be executed, a counterparty must take the opposite side of the contract by placing an order to short 1 BTC at the same price of HKEX:30 ,000. When both the long and short orders are matched and executed, the open interest increases by 1 BTC, reflecting the addition of this new contract to the market.
Changes in Open Interest essentially tell us 3 things:
- OI Increase - new positions entered the market (both longs and shorts!)
- OI Decrease - positions exited the market (both longs and shorts!)
- OI Flat - no change in open positions due to low activity or simply lots of transfers of contracts
However, different concepts can be used to analyze sentiment, aggressiveness, and activity in the market by analyzing data such as Open Interest, price, volume, etc. This indicator combines Open Interest data and price action to simplify the visualization of positions entering and exiting the market. It is based on the following concept:
Increase in Open Interest + Increase in price = Longs Opening
Decrease in Open Interest + Decrease in price = Longs Closing
Increase in Open Interest + Decrease in price = Shorts Opening
Decrease in Open Interest + Increase in price = Shorts Closing
When "Longs Opening" occurs, the OI Delta value is added to the running total of Net Longs, and when "Longs Closing" occurs, the OI Delta value is subtracted from the running total of Net Longs.
When "Shorts Opening" occurs, the OI Delta value is added to the running total of Net Shorts, and when "Shorts Closing" occurs, the OI Delta value is subtracted from the running total of Net Shorts.
To summarize:
Net Longs: Cumulative value of Longs Opening and Longs Closing (LO - LC)
Net Shorts: Cumulative value of Shorts Opening and Shorts Closing (SO - SC)
Net Delta: Net Longs - Net Shorts
Net Ratio: Net Longs / Net Shorts
This is the fundamental logic of how this script functions, but it also includes several other tools and options. Here is an overview of the settings:
Type:
- Net Positions (display values of Net Longs, Net Shorts, Net Delta, Net Ratio as described above)
- Relative Strength (display Net Longs, Net Shorts, Net Delta, Net Ratio in the form of a momentum oscillator that measures the speed and change of movements. Same logic as RSI for price)
Display as:
- Candles (display the data in the form of candlesticks)
- Lines (display the data in the form of candlesticks)
- Columns (display the data in the form of columns)
Cumulation:
- Visible Range (data is cumulated from the first visible bar on your chart)
- Full Data (data is cumulated from the beginning)
Quoted in:
- Base Currency (all data is presented in the pair’s base currency eg. BTC)
- Quote Currency (all data is presented in the pair’s quote currency eg USDT)
OI Sources
- Pick the sources from where the data is collected (if available).
Net Positions:
- NET LONGS (show/hide Net Longs plot, choose candle colors, choose line color)
- NET SHORTS (show/hide Net Shorts plot, choose candle colors, choose line color)
- NET DELTA (show/hide Net Delta plot, choose candle colors, choose line color)
- NET RATIO (show/hide Net Ratio plot, choose candle colors, choose line color)
Moving Averages:
- Type (choose between EMA and Volume Weighted Moving Average)
- NET LONGS (show/hide NL moving average plot, choose length, choose color)
- NET SHORTS (show/hide NS moving average plot, choose length, choose color)
- NET DELTA (show/hide ND moving average plot, choose length, choose color)
- NET RATIO (show/hide NR moving average plot, choose length, choose color)
Profile:
- Profile Data (choose the source data of the profile)
- Value Area % (set the percentage width of profile’s value area)
- Positions (set the position of the profile to left or right of the visible range)
- Node Size (set the relative size of nodes to make them appear smaller or larger)
- Rows (select the amount of rows displayed by the profile to control granularity)
- POC (show/hide POC- Point Of Control and select its color)
- VA (show/hide VA- Value Area and select its color)
Divergence finder
- Source (choose the source data used by the script to compare it with price pivot points)
- Maximum distance (the maximum distance between two divergent pivot points)
- Lookback Bars Left (the number of bars to the left of the current bar that the function will consider when looking for a pivot point)
- Lookback Bars Right (the number of bars to the right of the current bar that the function will consider when looking for a pivot point)
Stats:
- Show/Hide the Stats table
- Bars Back (choose the length of data analyzed for stats in number of bars)
- Position (choose the position of the Stats table)
- Select Data you want to display in the Stats table
Additional Settings:
- Volume Heatmap (show/hide volume heatmap and select its color)
- Label Offset (select how much the plot label is shifted to the right
- Position Relative Strength Length (select the length used in the calculation)
- Value Label (show/hide OI Delta values when candles are displayed)
- Plot Labels (show/hide the labels next to the plot)
- Wicks (show/hide wick when candles are displayed)
Code used for generating profiles is taken from @KioseffTrading's "Profile Any Indicator" script (used with author's permission)

Crypto Performance Index1. The Crypto Performance Index (CPI) estimates the price appreciation of a crypto asset relative to the overall crypto market performance. The indicator is calculated using a Sharpe Ratio principle enhanced with time-domain normalization and cumulative parametrization.
2. The CPI is based on the idea that the performance of an asset should be evaluated not only in terms of its absolute price movement, but also in terms of its risk-adjusted returns compared to the broader market. The Sharpe Ratio, which takes into account both the asset's return and its volatility, is a commonly used measure of risk-adjusted performance.
3. The CPI takes the Sharpe Ratio principle further by incorporating a time-domain normalization technique that adjusts for differences in volatility across different time periods. The cumulative parametrization ensures that the CPI considers the overall performance of the asset over a specified period of time.
4. To use the indicator, select a timeframe and set the standard deviation period (default is 20). The CPI line can be compared against various market benchmarks, including the total crypto market cap (white line), altcoins total market cap (blue line), low-cap altcoins (without ETH), and Bitcoin.
5. An upward slope of the CPI line indicates strong price performance of an asset, with a relatively high chance for the asset to continue growing faster than the market in the future. Conversely, a downward slope of the CPI line indicates weak price performance of an asset, with a relatively high chance for the asset to depreciate in price with respect to the rest of the market in the future.
6. Overall, the CPI provides a comprehensive measure of an asset's price performance, taking into account both its absolute return and its risk-adjusted return relative to the broader market. This makes it a valuable tool for investors looking to evaluate the performance of their crypto holdings and make informed decisions about buying, selling, or holding assets.

Trendmaster - Crypto Flow IndexWhat it is:
The Trendmaster Crypto Flow Index is a unique tool designed to give you an overview of the performance of different Crypto market sectors and sub-sectors. It helps you to identify where you should be focusing your investments for maximum portfolio efficiency and profitability.
What it does:
The Crypto Flow Index presents a visual overview of the flows of retail and institutional capital into the four main market sectors: Large Caps, Alts Coins, Shit Coins, and Stable Coins as well as several other sub-sectors. Each sector is assigned a "Flow Score", which indicates its current performance, demand, and strength in percentage terms. The "Flow Score" also provides insights into the current stage of the market cycle and the typical over and underperformances of assets that correlate to it. Additionally, the index factors in the sector have a "Correlation" to the broader market, allowing you to see the best sectors for trading and investing, either for positional hedging or differential plays.
How to Use it:
To use the Trendmaster Crypto Flow Index, you can simply observe the evolving colored line within the indicator and the table overview. You can identify which sectors are outperforming or underperforming the general market and make informed decisions about where to direct your focus and funds. By monitoring the transitions of Flow between sectors, you can gain invaluable insights into the market cycle and the typical over and underperformances of assets that correlate to it. This information will help you to maximize portfolio efficiency by targeting different market sectors based on their performance to the overall cryptocurrency market. The index covers different sectors, including Large caps, Alts, Shit, Stables, AI, Defi, Dex, Exchange, Gaming, Meme, Metaverse, Nft, Privacy, Smart, and Sports.
Examples of Cryptocurrencies represented in the different market sectors:
Large caps: The biggest market cap cryptocurrencies such as BTC and ETH.
Alts: High-cap and high-volume digital assets that are smaller than large caps, such as LTC and XRP.
Shit coins: Smaller cap projects that are highly speculative and experience significant price volatility, such as BAT and HOT.
Stables: Fiat-pegged assets that provide a stable value, such as USDT and USDC.
AI: Projects that are based on artificial intelligence, such as FET and AGIX.
DeFi: Leverages high volume smart contract platforms to provide financial products in crypto, mainly ERC20 tokens such as LINK and AAVE.
DEX: Decentralized exchanges with their own utility tokens, such as UNI and SUSHI.
Exchange: Centralized exchanges with their own utility tokens, such as BNB and CRO.
Gaming: Web3/crypto gaming platforms with their own utility tokens, such as AXS and GMT.
Meme: Similar to shit coins, but with no real functionality and based purely on social media and memes, such as DOGE and SHIB.
Metaverse: Projects that aim to provide Metaverse assets such as virtual land and assets, such as MANA and SAND.
NFT: Non-fungible tokens with their own token or NFT-based platforms that have their own utility tokens, such as APE and LOOKS.
Privacy: Anonymous and privacy-focused chains, such as XMR and ZEC.
Smart: Projects that provide smart contract alternatives to ETH, such as ADA and AVAX.
Sports: Fan tokens based on real-world sports teams or platforms that support and distribute them, such as CHZ and FLOW.

FlashTrade 20 Asset ScreenerThe FlashTrade 20 Asset Screener is a powerful screening tool written in Pinescript and designed for use in Tradingview. It simultaneously monitors a combination of seven (7) lagging and three (3) leading indicators for twenty (20) assets, such as; stocks, cryptocurrencies, or forex pairs.
The screener sends summarized numeric data as an alert to external programs that specialize in automated trading. This proprietary technology developed by the algorithmic trading firm known as FlashTrade.AI is now integrated with the rules-based trading platform TradeLab.AI.
The lagging indicators tracked by the screener are as follows:
1. The 8 Period Exponential Moving Average (8EMA): It determines whether it is over or under the 21 Period Exponential Moving Average (21EMA).
2. Two Closes of the 8 Period Exponential Average (8EMA): This confirms a trend as either bullish or bearish when it occurs over or under the 21 Period Exponential Moving Average (21EMA).
3. Ichimoku Cloud: This indicator identifies whether the price is above or below the cloud, indicating bullish or bearish trends.
4. Ichimoku Cloud: Conversion Line Above Base or Conversion Line Below Base: This measures the trend strength based on the distance between the conversion line and the base line.
5. Ichimoku Cloud: Lag Line Above Price or Lag Line Below Price: This tracks the lag line's position relative to the current price to confirm trend direction.
6. Ichimoku Cloud: Leading Cloud Green or Leading Cloud Red: This identifies the trend based on the color of the leading cloud.
7. MACD: This oscillator tracks the difference between two exponential moving averages and helps identify bullish or bearish momentum in the market.
The screener also tracks three leading indicators that primarily measure trading volume and momentum. These leading indicators are:
1. The Relative Strength Index (RSI): This oscillator measures the speed and change of price movements to identify overbought or oversold conditions in the market.
2. The Stochastic: This oscillator measures the momentum of price movements and helps identify potential trend reversals in the market.
3. The relative Vigor Index (RVGI): This indicator measures the strength of price movements by comparing the closing price to the trading range and helps identify trend reversals.
Overall, the FlashTrade 20 Asset Screener is a powerful tool for traders looking to automate their trading strategies. By monitoring multiple indicators for multiple assets simultaneously, it can identify trends and capitalize on opportunities when they present themselves.

Dynamic Volume Oscillator [CryptoScripts]The Dynamic Volume Oscillator uses a combination of volume and momentum to nail whenever a reversal is likely to happen. I've also included divergences (both regular and hidden) that you can toggle on/off and adjust the settings to fit your trading style.
Colors - The green wave indicates an uptrend while the purple wave indicates a downtrend.
Overbought/Oversold - Green backgrounds indicate the DVO is oversold and a reversal to the upside is likely to happen within the next few candles. Red backgrounds indicate the DVO is overbought and a reversal to the downside is likely to happen within the next few candles. You can adjust the levels to trigger when the signal flashes. Experiment with different timeframes/altcoins to see which settings work best. Some coins are more volatile than others and lower timeframes tend to reach higher levels vs higher timeframes.
Divergences - The settings of 1 and 3 for the lookbacks are so the divergence signal appears only 1 candle before the actual divergence happens (on the replay tool) vs 4-5 candles from other indicators. This means your entry on a divergence signal is 2 candles after it prints (for backtesting purposes).
Alerts - I also added alerts for Overbought, Oversold, Regular and Hidden Bearish/Bullish Divergences.
Let me know if you have any questions! Enjoy :)

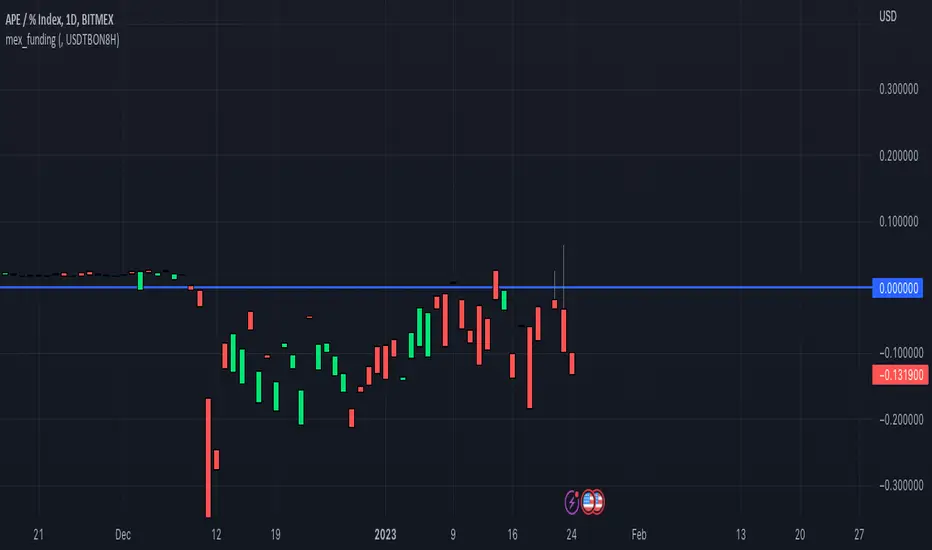
mex_fundingScript for calculating Bitmex funding based on the Premium tickers Bitmex submits to Tradingview
Make sure you add the correct Bitmex Interest Base and Quote Symbols in the input settings
For example for www.bitmex.com the inputs are:
Chart ticker: XBTUSDPI8H
Input Settings
Interest Base: XBTBON8H
Interest Quote: USDBON8H
Crypto Tipster v2 - Trend Oscillator---------------------
Crypto Tipster v2 - Trend Oscillator
Following on from the release of Crypto Tipster v2 toward the end of 2022, we've been working on a way to visually represent how our indicator works, so our members can utilize more tools and therefore make better informed trading decisions by setting up Crypto Tipster v2 more accurately to suit their individual trading needs.
Trend Oscillator is designed to work alongside Crypto Tipster v2 by providing an oscillating line graph between 0-100. This plot indicates the overall trend strength when all our Crypto Tipster algorithms combine and will help you understand the inherent movement behind the scenes within Crypto Tipster v2.
We have included options that have been previously unavailable within Crypto Tipster v2 - including:
- A variable threshold of trend strength before placing orders
- The ability to place orders when trend strength crosses the mid point of the oscillator (50)
- Placing orders when the trend oscillator detects a change in direction
As well as these options as listed above we've included a function to overlay a Moving Average onto the trend oscillator to help smooth out any potential whipsaw's and false moves. This is particularly helpful when combined with "placing orders on direction change" as listed. Numerous moving average options have been included which include (but are not limited to) SMA, EMA, WMA, VWMA, DEMA, TEMA, SMMA, Hull, ZEMA.. the list goes on!
We've been wanting to include several features like these and more within Crypto Tipster v2 for some time now, but have found it difficult to include these features without causing a certain amount of confusion over what they are, what they do, how they work and therefore what their benefits actually are - a few words and an input box just don't portray the message we need to get across when used solely within Crypto Tipster!
With "Trend Oscillator" we can now release all of these updates without concern of being mis-understood. The visual representation that this oscillator offers helpfully describes what we couldn't describe within Crypto Tipster v2 before.
This script is free to use for all, you don't even need to be a member of Crypto Tipster - however, those of you who are signed up with theCrypster will definately receive the biggest benefit from this script. Alerts are not available with our Trend Oscillator, as are "Buy", "Sell" or "Close" labels on the main chart.
We've got many more updates and add-ons planned for the coming weeks and months, stay tuned!
---------------------
We've tried to make Trend Oscillator as comprehensive and easy to understand as possible, we are however always in search of progression; we do really love to hear your feedback :)
For more information or for a 7-day free trial of Crypto Tipster v2 please visit the link in our signature!
Happy Trading Guys

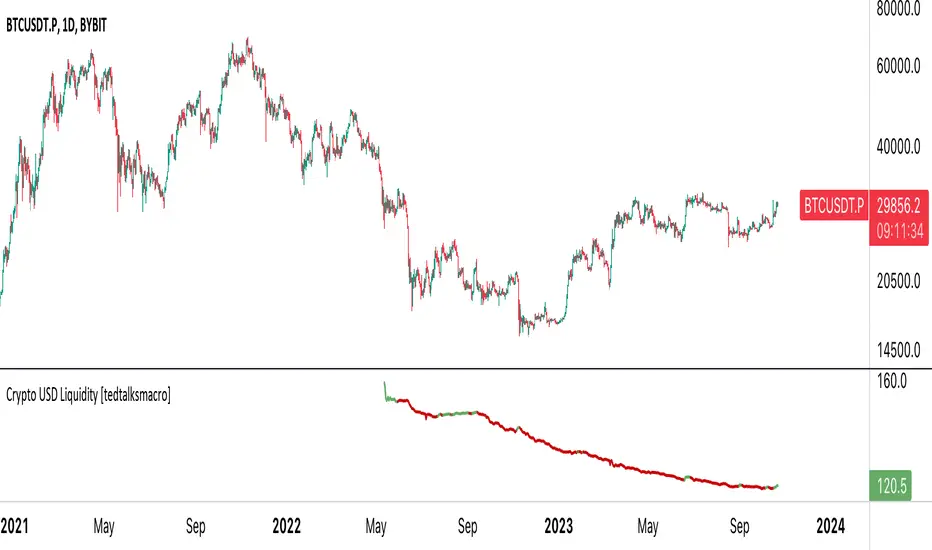
Stablecoin supplies [USD bn]This script shows crypto market inflows/outflows by showing the USD stablecoin supplies, using data from glassnode.com :
GLASSNODE:BUSD_SUPPLY
GLASSNODE:USDT_SUPPLY
GLASSNODE:USDC_SUPPLY
Using a simple 20 EMA, the line will change color showing stablecoin inflow or outflow. Traders can consider stable coin inflows (green) as bullish for Bitcoin price, while stable coin outflows (red) should be considered bearish for price.