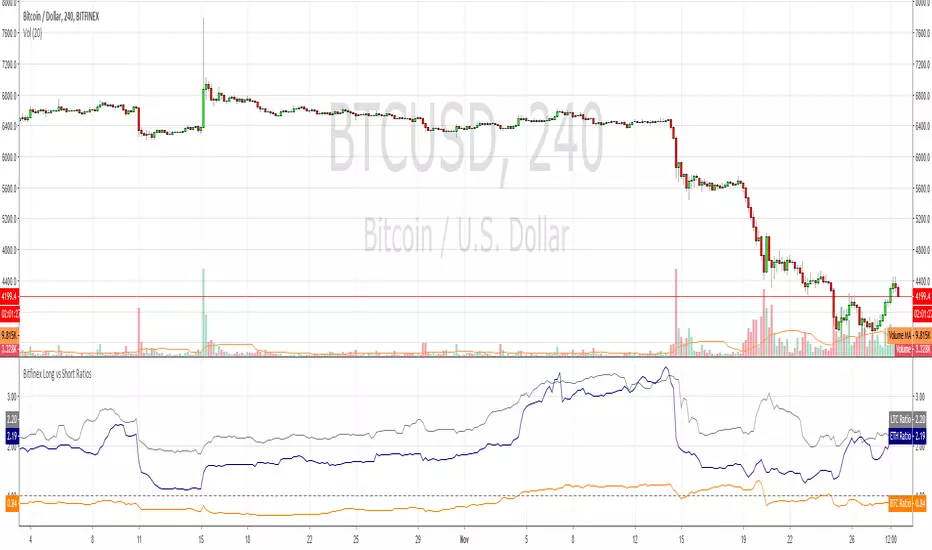
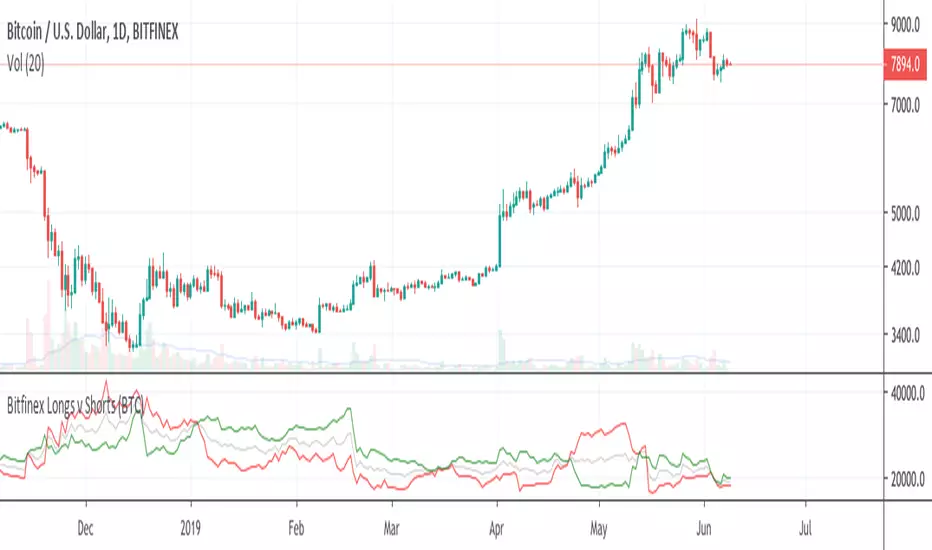
Bitfinex Long vs Short RatiosWas impressed with the 'Longs vs Shorts Ratio' idea from the tweet below so I coded an indicator, enjoy.
twitter.com
คริปโต

Random Walk SimulationUnderstanding the Random Walk Simulation
This indicator randomly generates alternative price outcomes derived from the price movements of the underlying security. Monte Carlo methods rely on repeated random sampling to create a data set that has the same characteristics as the sample source, representing examples of alternate outcomes. The data set created using random sampling is called a “random walk”.
First, every bar in the time stamp is measured and put into a logarithmic population. Then, a sample is drawn at random from the population and is used to determine the next price movement of the random walk. This process is repeated fifteen times to visualise whether the alternative outcomes lie above or beneath the current market price of the security.
Random Walk Utility
The random walk generator allows users of the Monte Carlo to further understand how the Monte Carlo projection is generated by creating a visual representation of individual random walks. Trends that occur on the random walks may correlate to the historical price action of the underlying security.
You can find the Monte Carlo Simulator here:
Input Values
Select the “ Format ”, button located next to the indicator label to adjust the input values and the style.
The Random Walk indicator only has one user-defined input value that can be changed.
The Random_Variable randomises a set of random walks. If this variable is changed, it will run a fresh set of 15 random walks which will result in a slightly different outcome.
Adding the indicator to your chart multiple times using many different random variables will allow you to achieve a more accurate reading. Ideally, the Monte Carlo Simulator takes an average of these to be interpreted.
For more information on this indicator, the full PDF can be found here: www.kenzing.com

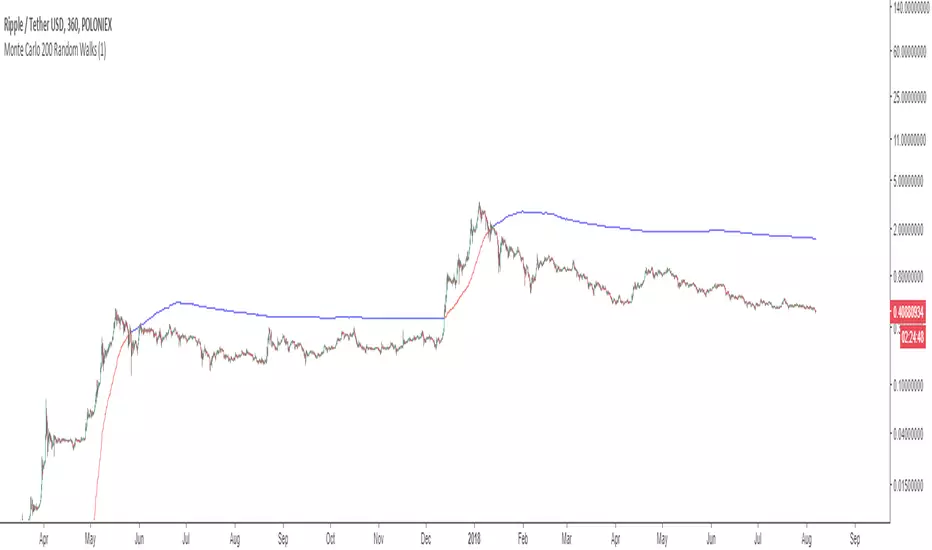
Monte Carlo Simulation (200 Random Walks)Understanding the Monte Carlo Simulation
This indicator uses Monte Carlo methods to predict the future price of a security using 200 random walks.
Monte Carlo methods rely on repeated random sampling to create a data set that has the same characteristics as the sample source, representing examples of alternate possible outcomes. The data set created using random sampling is called a “random walk”. Obtaining a mean from 200 random walks allows us to benchmark the performance of the source against the random walks obtained from the source.
Monte Carlo Utility
This Monte Carlo simulator plots a single line that represents 200 random walks across any security and time stamp. The line is red if most of the random walks are lower than the price of the security, and blue if the walks are higher.
Input Values
Select the “ Format ”, button located next to the indicator label to adjust the input values and the style.
The Monte Carlo indicator has only one user-defined input value that can be changed.
The Random_Variable determines set of random walks. If this variable is changed, it will run a fresh set
of 200 random walks which will result in a slightly different outcome. 200 random walks will load
relatively quick and produce roughly the same outcome as 10,000 random walks.
Adding the indicator to your chart multiple times using many different random variables will allow you
to achieve a more accurate reading.
For more information on this indicator view the PDF here: www.kenzing.com
Block Sale Transaction Alert!Understanding Block Transactions
Block transactions are transactions that are of a significantly high value. This can be a transaction of any
security that is large enough to have an impact on the market price and cause a flow-on effect of
investment that will ensue.
Block transactions are significant because the party who initiated the transaction is likely to be more
confident than the retail investor. Confidence can be assumed by the value of the transaction and the
source can be either,
a) an institutional fund with access to detailed and reliable information
or
b) a party with secret, insider knowledge that is currently undisclosed to the market.
For these reasons, being aware of block transactions is extremely important for anyone looking for a
new investment opportunity or risk management of current holdings.
Block Transaction Utility
This indicator is compatible with instant E-mail and SMS notifications so that the investor will be well
informed of institutional activity and make trading decisions quickly.
If a block transaction occurs, the user will be able to visualize whether it was a purchase or sale as it will
be textualized above or below the current bar if used with the Block Transaction Buy Alert found here:
Input Values
The visual representation of the transactions are customizable as you can adjust the shape, color, and
location by clicking “ Format ” at the top left of your chart, next to the indicator label.
Setting up Text message or E-mail Notifications
In order to receive the text message and/or email alerts, you will need to make sure the correct contact
information is saved in your TradingView® account settings.
For more information on this indicator, and setting up alerts, view this PDF: www.kenzing.com

SignalToSignal.com - Logical Volume Trading SystemOur Logical Volume Trading System is a vast improvement on ‘standard’ volume spread analysis. Based on 15+ year combined experience with our Smart Volume Spread Analysis software, we have refined our analysis and algorithms to provide the most powerful VSA indicator on TradingView.
Combining fundamental analysis, technical analysis, and volume analysis into a powerful methodology that enables you to trade the markets in a way that is uniquely accurate.
The Signal to Signal Logical Volume Trading System quickly handles time-consuming manual background analysis, volume analysis, and signal analysis leaving you free to make considered and knowledgeable trading decisions instantly.
We have refined our price action and volume analysis algorithms to focus on the core trading signals, which often precede large moves, providing you with clear insight and a roadmap to trading successfully.
Due to unique characteristics of the Pine programming language that TradingView indicators utilize, we have also made adjustments to the signal validation and advisor systems. The result is a clean, easy to read chart which allows you to recognize strong setups as soon as they form.
Lastly, our Logical Volume Trading System is customizable. You can choose which signals and advisor warnings are enabled, allowing you test any number of ideas and analysis combinations. Of course the system is optimized for most charts by default so you can get started right away.
To gain access to the Logical Volume Trading System, please visit our website .
If you have any questions, please contact us through the Contact link on our website - signaltosignal.com

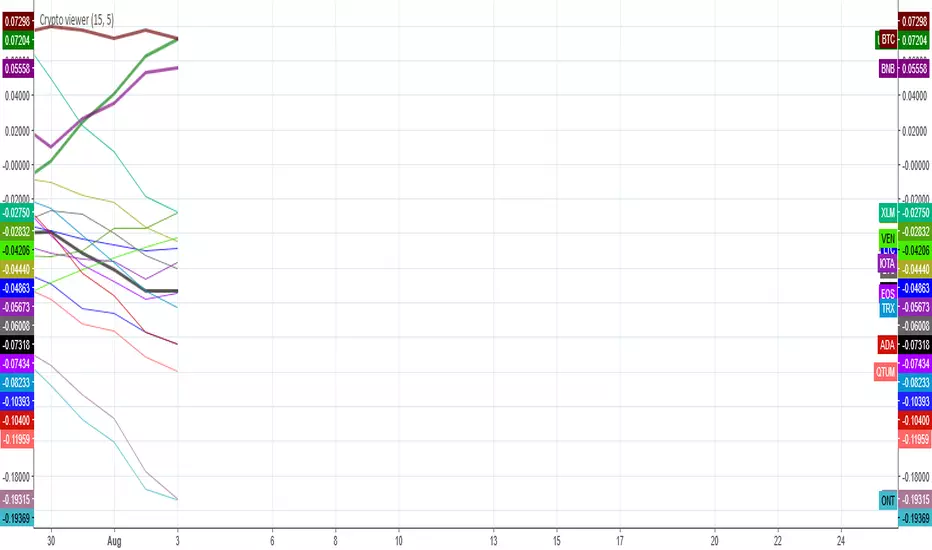
Crypto MeasurerI'm proud to finally announce the Crypto measurer!!!, 20 coins chosen from the selection available at Binance, you're free to modify the code to add your own coins or remove them or if you use another exchange.
This works similar to the SCSM, except it's for cryptos, never miss a PUMP & DUMP scheme again, don't get tricked into buying the losing coins anymore. The stronger coins are at the top while the losing coins at the bottom, works on any TF too, but be careful of volatility in lower TFs.
This picture is only of ETH and BTC, see how ethereum rallies in mid april until mid may, then bitcoin becomes the more dominating coin and remains like that, pushing ETH/BTC lower.
Again, here it's the chart for ETH and BNB, with the corresponding comparison.
And here is LTC/BTC to finish the comparisons.

EdgeAnalysisGroup: Fibbonaci BarsPrivate Message me for more info and EAG Scripts
-------------------------------------------
Colored bars based on EAG Fib MA script.
Potentials:
colorA changes to colorB going down = Open Short or Short Continuation
colorA changes to colorB going up = Open Long or Long Continuation
colorA changes to colorB and the next bar is colorA = Reversal Pattern
Based if used with the Yume Wave or a crypto modified RSI indicator
to determine the likelyhood of color reverse or breakout

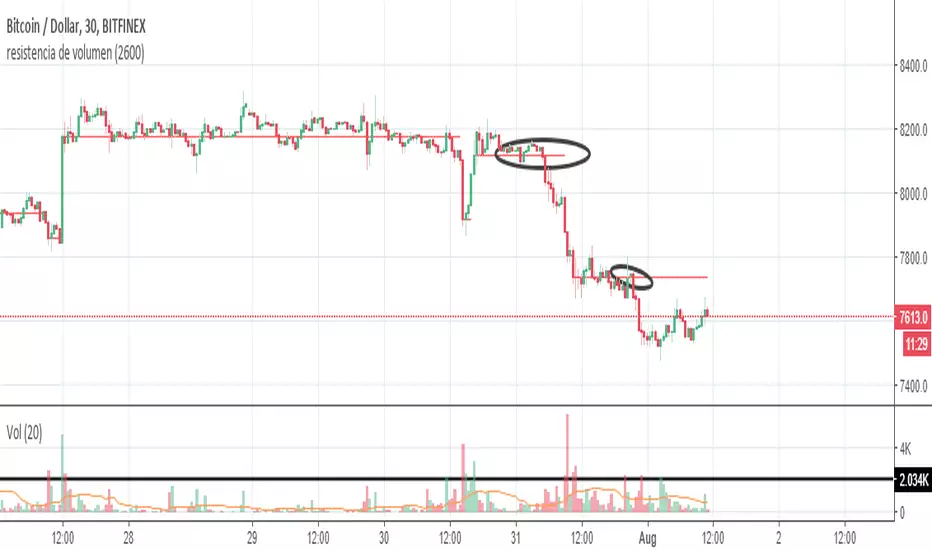
Resistance of VolumeIt is used to detect volume resistors in a personalized way, since it allows the user to enter the volume in which he wishes the resistance to jump automatically.
It does not mark the black line and the graphic that's just to help understand how it works
in the above image can see the indicator works on 30 minutes chart
in the above image can see the indicator works on 5 minutes chart
therefore, it can be configured to go through several temporalities.
Swinger v2This script is used for swing trading:
Rules for reading indicator plot:
1) BUY: on green
2) SELL: on red
3) The height of the indicator tells the strength of the trend.
Message me for access

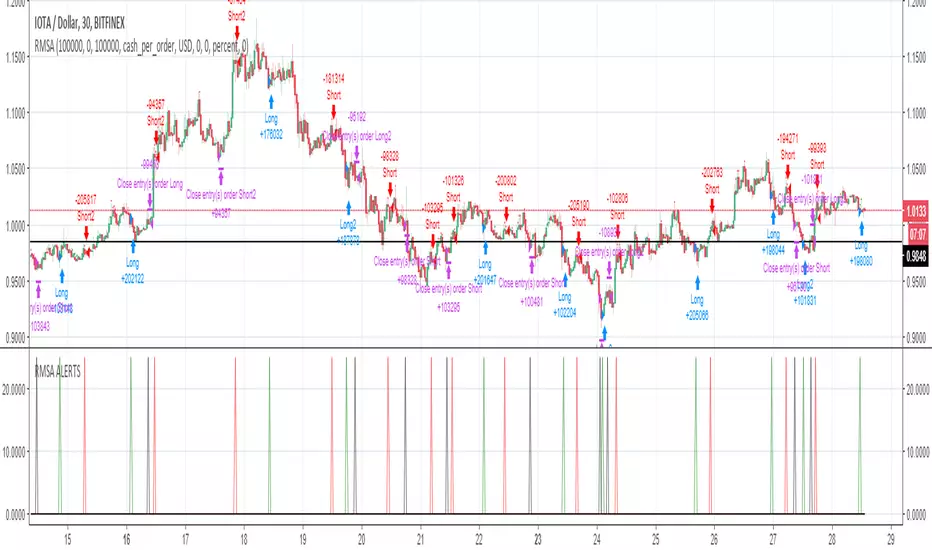
RMSA - Strategy - BTC/IOT/BCH/EOS - no repaint ALERTSHi Alerts for Strategy
Put alerts on Bar closed
Trendster v1.0The Trend Is Your Friend
Trendster v1.0 will give you simple areas of possible entries (both long and short) in order to jump on board new trends early and stay in the trade for maximum profit. Can be used with most assets including equities, FOREX and cryptocurrencies. Alerts can be created from this indicator allowing for better manual trade timing or autotrading. Happy trading!

Longs Shorts & Divergence (LSD) (Ratio, Diff, Total) [cI8DH]This indicator automatically identifies the ticker for the current chart and shows margins at Bitfinex (or any other exchange if listed on Tradingview). So if your chart is reading EOSUSD at Kraken, this indicator will show EOSUSDSHORTS and EOSUSDLONGS at Bitfinex.
Features:
- Total of longs + shorts ("could" be an indicator of market attractiveness)
- Difference between longs and shorts (good if you want to have only one chart)
- Longs to total margin ratio in percentage
- Highlighting of indicator background when margins diverge too much from price (sensitivity of divergence is adjustable, divergence can be applied to longs, -shorts, longs+shorts, longs-shorts)
- Price factoring (gives a consistent metric when switching between different coins)
- Tickers can be set to a fixed value or automatically extracted from the current chart (fixed is useful for hybrid tickers)
- Margin exchange can be modified (default is Bitfinex)
- Offset for longs (helps with scaling)
Read the description in the TA below for getting access to this script.

Xypher Long/Short Finder (PSAR)Looks for longs and shorts on downtrends and uptrends, using EMAs to define the trend and PSAR to look for entries.
You can deactivate up/down trend longs/shorts on the settings according to your needs. My favorite setup is to find bottoms/tops with it:
Use uptrend shorts if you are looking to short at the top.
Use downtrend longs if you are looking to go long on the bottom reversal.
Basic setup: ride the waves by looking for longs on uptrends and shorts on downtrends.
Scalping setup: find an asset uptrending on a big timeframe (daily, weekly), and look for longs on both up/downtrends on smaller timeframes.
Ichimoku cloud was added to help further with the search of supports and resistance, along with 50,100 and 200 EMA.
Candles are colored according to the trend, to view it, hover the mouse over the indicator or bring it to the front (Right Click -> Visual Order -> Bring to Front). Description is on the chart

10/20 SMA HA STRATEGY for LONGS & SHORTSTrade Long when Arrows go up (B signal for Buy (Long))
Trade Short when Arrows go down. (S signal for Sell (Short))
C for close positions. first priority is always protect your capital and your profits even at the expense of more profits

Bitfinex Open Interest ChangeThe script shows changes in Bitfinex open interest from the previous candle.
Key:
Positive green bar = Open interest increase, predominantly longs opening.
Positive red bar = Open interest increase, predominantly shorts opening.
Negative green bar = Open interest decrease, predominantly longs closing.
Negative red bar = Open interest decrease, predominantly shorts closing.
Token selection between top trading pairs is in the options.

Bitfinex Longs v Shorts - Token Selectorimgur.com
The script enables you to easily switch between the top trading pairs on Bitfinex to show the long vs. short data.
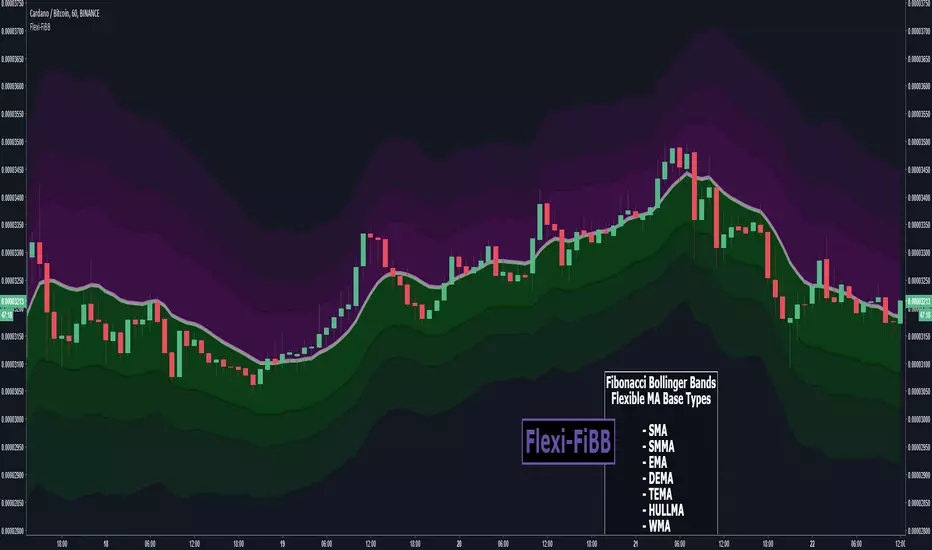
Flexi-FiBBFlexible Fibonacci Bollinger Bands
Colorful 3d Bands displaying Support and Resistance areas based off of Fibonacci Ratios in a customization Bollinger Band.
Choose from vary types of moving average types to get the perfect fit for your trade style.
MA Types Available
- SMA
- SMMA
- EMA
- DEMA
- TEMA
- HULL-MA
- WMA
- VWMA
You can purchase access to this indicator via CryptoProTools
Other recent indicators proving popular among members lately :

Gecko Ultimate Margin Trading Script (V1-STD)I am Gecko, and I can change myself flexibly to fit all types of terrain.
Contact me for a trial period.

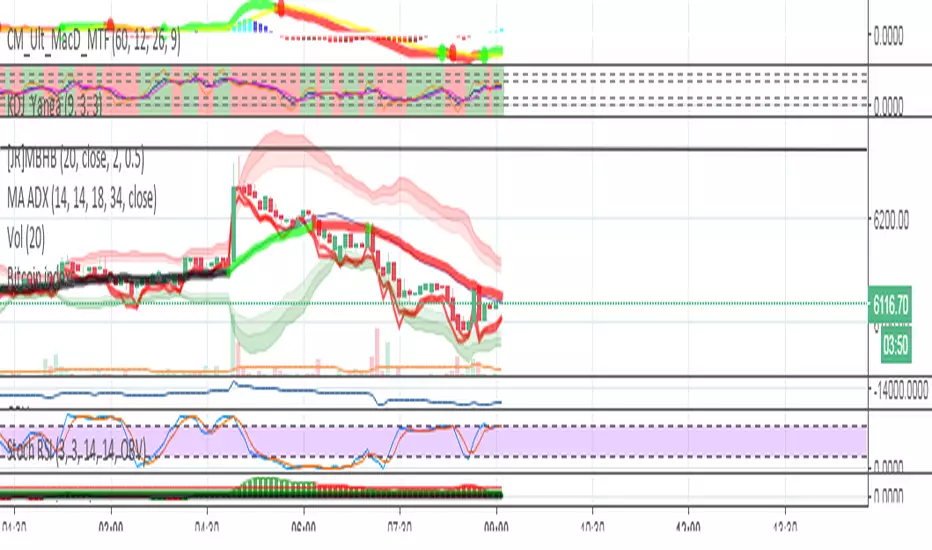
Bitcoin indexsDisplays average high and low, of the combined exchanges: Binance, Bittrex, Poloniex, Bitfinex, Bitmex, so that you can see arbitrage, and smooth out differences of exchanges for more realistic charting.
Bull ComparisonBull Comparison is a script that compares the Bull trends for upto 10 coins. This could be dizzying, so for starters start with 3 coins and turn off the 7 remaining in the settings. Default 3 coins are BNB, BTC, ETH USDT. User can customize the coins they want to check, just follow the format in the settings - to see if there is meaningful correlation with other pairs.
