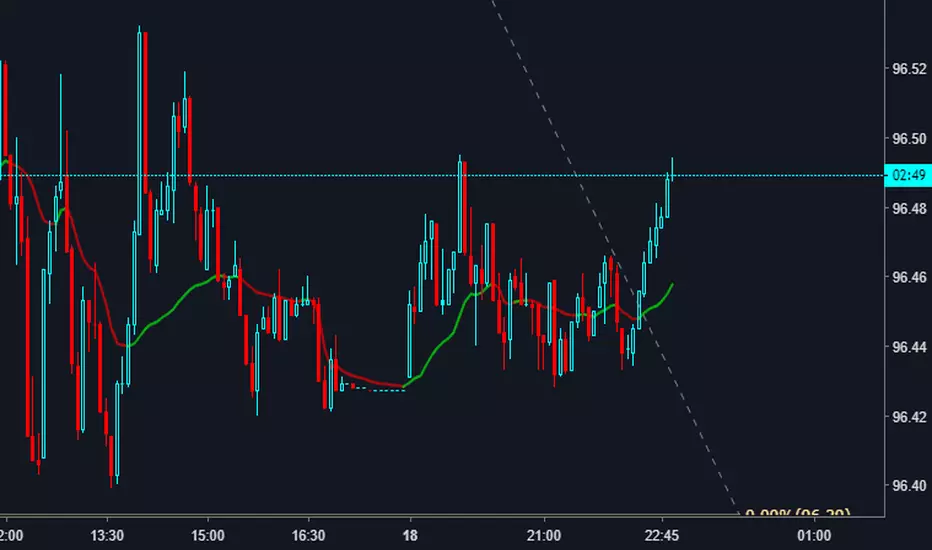
CRYPTONYY TRADING MACHINEThia script will automatically gives you long and short signals.
WORKS ON ALL EXCHANGE.
SUITABLE FOR BITMEX TRADING.
FOR ALTCOINS TRADING GO FOR 30MIN OR ABOVE 30MIN TIMEFRAME.
AUTOMATIC STOP LOSS TRIGGER.
MORE NEW UPDATES COMING!!!
คริปโต

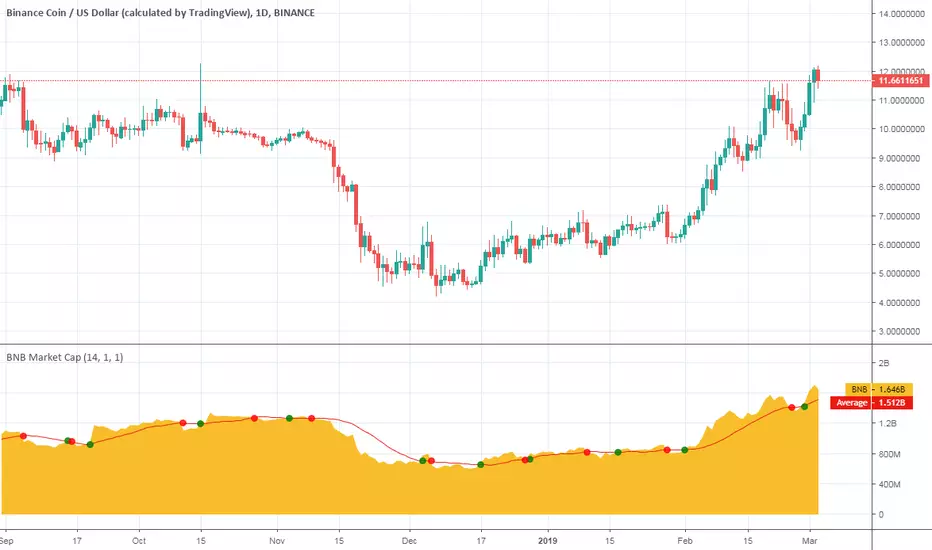
Binance Coin Market CapHey there!
This is Binance Coin market cap with some additional features.
Consider it as my Christmas gift to the community.
What is included
Dynamic market capitalization chart
Customizable SMA of the market capitalization
Crossovers highlighting
You can set alerts for crossovers
Alert for the specified positive % change
Alert for the specified negative % change
NOTE : The word "Dynamic" means that I did not hardcode the supply of the presented coin. You can check it over time.
Good luck and happy trading!
CCV MA SelectorScript allows you to choose a timeframe other than current timeframe to view certain MA or EMAs. For example, you can view the Weekly MA while viewing an hourly chart.
Three inputs for three separate MA lines. Default is 200 on D, 3D and W
MA and EMA available, switch by selecting the EMA box. Default is the simple MA.
Works on all assets.
If asset is young with insufficient data for a particular MA that MA will not be plotted.
Script is completely free but I do request that you like the script and follow me here on TV.

Total Volume for BTC or ETHBITMEX:ETHUSD BITSTAMP:BTCUSD Script includes cumulative Bitcoin volume from exchanges such as Binance, Bitfinex, Bithumb, Coinbase and more
As default, volume is shown based on the number of Bitcoin moved
If volume increases day over day the color will be blue, if it dereases the color will be red. This is not related to price
You can currently switch between ETH or BTC by putting those abbreviations in on the settings inputs
You can also switch to a USD output
You can remove Bitmex data as this exchange is highly leveraged contracts, default includes Bitmex data
Some delays in loading as the indicator pulls data from multiple exchanges
Future updates may include availability of other coins or additional exchanges added

SeerFirst, we cheat, then, we go broke. Maybe.
Seer is a private technical indicator based on volatility, trend analysis, volume, flow and reversion. It is incredibly accurate across every asset class, including: futures, indexes, individual equities, commodities, forex and crypto. It can be used on every timeframe, from the 1m for fast, high strike rate scalps, to the daily or weekly for longer-term positions. Due to it's insane strike rate it will not be made public (examples below). If you are a billion-dollar hedge fund I may consider selling the indicator, otherwise the expected value from selling it is less than the edge I would give up by sharing it. If you have a counter-offer feel free to send me a message.

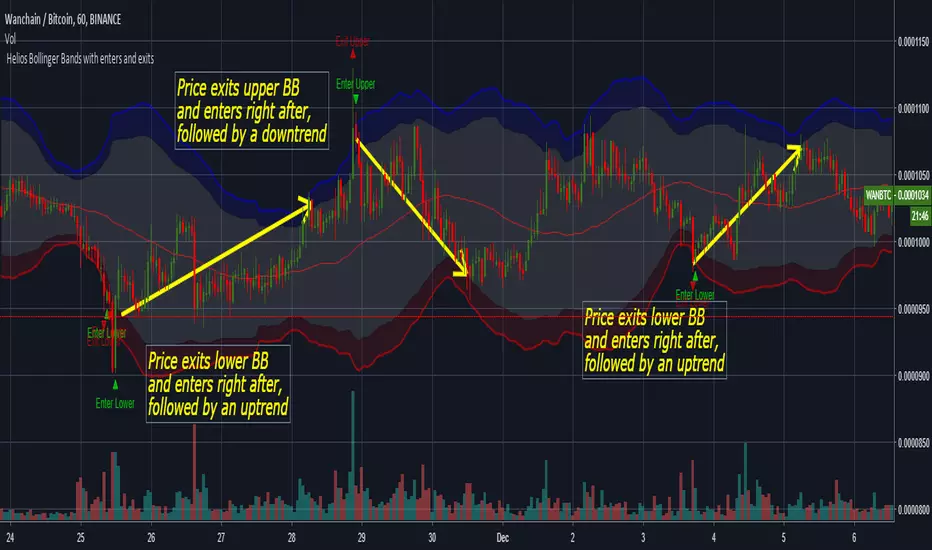
Helios Bollinger Bands with enters and exits by ZekisClassic Bollinger Bands with enters and exits from the channel
The purpose of Bollinger Bands is to provide a relative definition of high and low prices of a market. By definition, prices are high at the upper band and low at the lower band. This definition can aid in rigorous pattern recognition and is useful in comparing price action to the action of indicators to arrive at systematic trading decisions
The use of Bollinger Bands varies widely among traders. Some traders buy when price touches the lower Bollinger Band and exit when price touches the moving average in the center of the bands. Other traders buy when price breaks above the upper Bollinger Band or sell when price falls below the lower Bollinger Band . Moreover, the use of Bollinger Bands is not confined to stock traders; options traders, most notably implied volatility traders, often sell options when Bollinger Bands are historically far apart or buy options when the Bollinger Bands are historically close together, in both instances, expecting volatility to revert towards the average historical volatility level for the stock.
When the bands lie close together, a period of low volatility is indicated. Conversely, as the bands expand, an increase in price action/market volatility is indicated. When the bands have only a slight slope and track approximately parallel for an extended time, the price will generally be found to oscillate between the bands as though in a channel.
Traders are often inclined to use Bollinger Bands with other indicators to confirm price action. In particular, the use of oscillator-like Bollinger Bands will often be coupled with a non-oscillator indicator-like chart patterns or a trendline . If these indicators confirm the recommendation of the Bollinger Bands , the trader will have greater conviction that the bands are predicting correct price action in relation to market volatility .
en.wikipedia.org
Enjoy!
@Zekis
NAVI'S PERFECT TSIThe NAVI'S PERFECT TSI Indicator is the same as the True Strength Index (TSI) developed by
NAVI, except the SMI includes a signal line. The SMI uses double moving averages
of price minus previous price over 2 time frames. The signal line, which is an EMA of the
SMI, is plotted to help trigger trading signals. Adjustable guides are also given to fine
tune these signals. The user may change the input (close), method (EMA), period lengths
and guide values.
You can use in the xPrice any series: Open, High, Low, Close, HL2, HLC3, OHLC4 and ect...

CryptocloudHere's a cloud witn both, original & crypto settings.
I had to make some little tweaks in order to get the cloud accurate.
Works well & has more fun in low timeframes. 3D effect :)

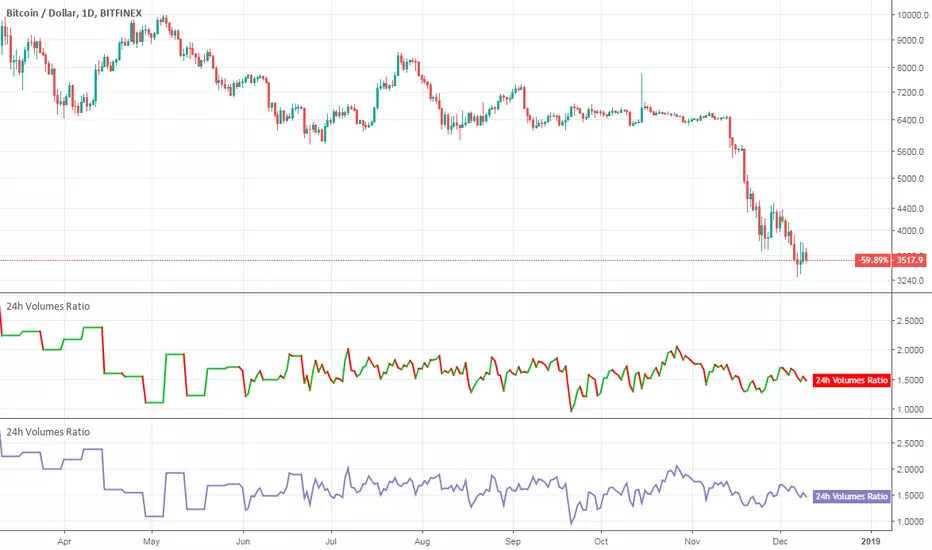
Crypto Mineable vs Not Mineable (24h Volumes Ratio)Hello traders!
This indicator shows you the dynamic ratio between 24h total volumes of the mineable and not mineable cryptocurrencies from TOP-40 according to coinmarketcap.com .
NOTE : The word "dynamic" means that I didn't have to hardcode 24h volumes from coinmarketcap.com for the presented cryptocurrencies - all values are updated automatically.
How to get access
You can buy it for only 30$ to get lifetime access
Happy Trading!
Crypto Mineable vs Not Mineable (24h Volumes)Hello traders!
This indicator shows you the dynamic 24h total volume charts of the mineable and not mineable cryptocurrencies from TOP-40 according to coinmarketcap.com .
NOTE : The word "dynamic" means that I didn't have to hardcode 24h volumes from coinmarketcap.com for the presented cryptocurrencies - all values are updated automatically.
How to get access
You can buy it for only 30$ to get lifetime access
Happy Trading!


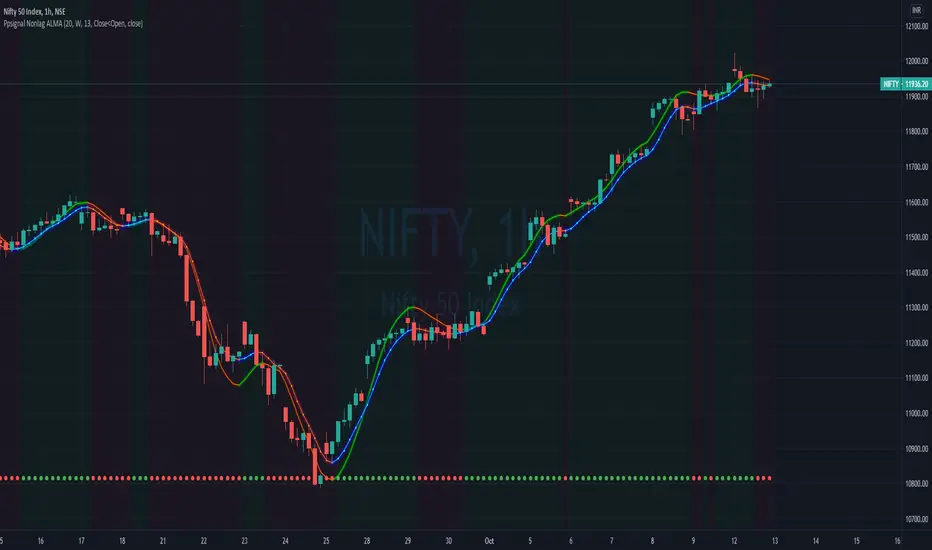
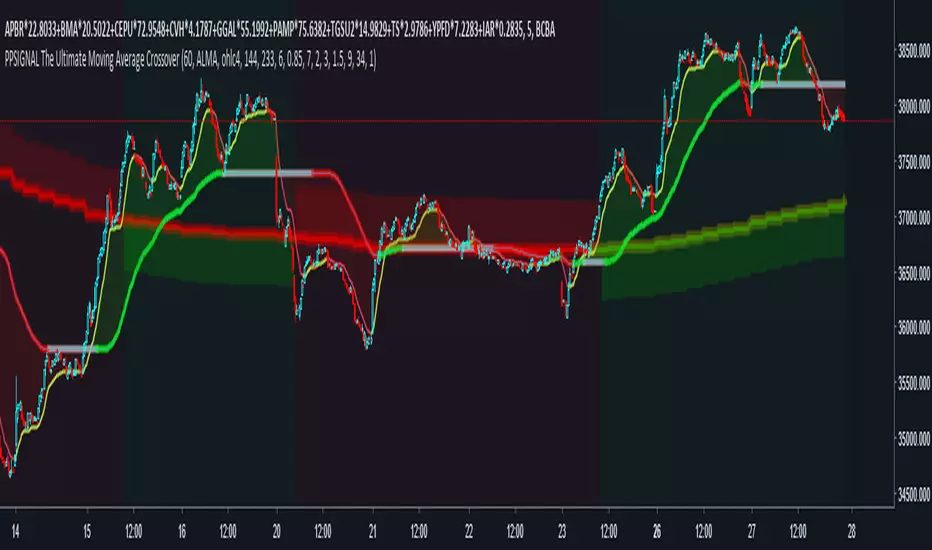
PpSignal The Ultimate Moving Average Crossover 3.0 (CFB)CFB tells you how long the market has been in a quality trend. This value can be used to adjust the period length of other indicators, especially stochastic bands.In order to quantify the overall duration of a market's trend, we replaced classical cycle analysis methods (FFT, MEM, MESA) with a form of analysis that works even when no cycles exist. We accomplished this by examining a time series for specific fractal patterns of any size. We then gather all the patterns found and combine them into one overall index, CFB (Composite Fractal Behavior) Index.For good reason, CFB does not analyze time series data for dominant cycles. Classical cycle analysis examines data points (e.g. prices) and estimates the average presence of a cycle in the window. Now suppose a cycle with a period length of 9 days was strong for 50 days and then disappeared for the next 21 days

Ehlers MESA Adaptive Moving Averageeveloped by John Ehlers, the MESA Adaptive Moving Average is a technical trend-following indicator which, according to its creator, adapts to price movement “based on the rate change of phase as measured by the Hilbert Transform Discriminator”. This method of adaptation features a fast and a slow moving average so that the composite moving average swiftly responds to price changes and holds the average value until the next bar’s close. Ehlers states that because the average’s fallback is slow, you can create trading systems with almost whipsaw-free trades.
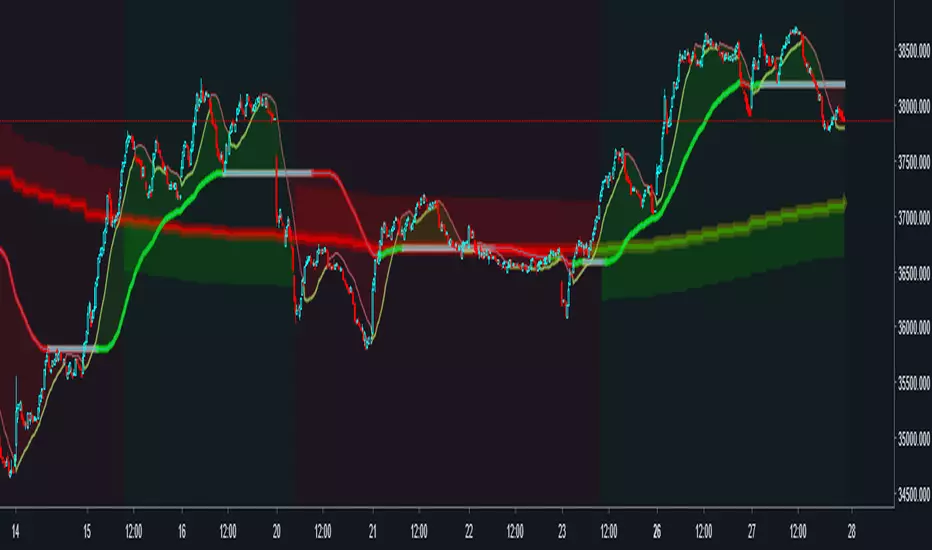
PpSignal Non lag ALMAThe zero lag exponential moving average (ZLEMA) indicator was created by John Ehlers and Ric Way.
As is the case with the double exponential moving average (DEMA) and the triple exponential moving average (TEMA) and as indicated by the name, the aim is to eliminate the inherent lag associated to all trend following indicators which average a price over time.
The formula for a given N-Day period and for a given data series is:
{\displaystyle {\textit {Lag}}={(Period-1)/2}} {\textit {Lag}}={(Period-1)/2}
{\displaystyle {\textit {EmaData}}={Data+(Data-Data(Lagdaysago))}} {\displaystyle {\textit {EmaData}}={Data+(Data-Data(Lagdaysago))}}
{\displaystyle {\textit {ZLEMA}}={EMA(EmaData,Period)}} {\textit {ZLEMA}}={EMA(EmaData,Period)}
The idea is do a regular exponential moving average (EMA) calculation but on a de-lagged data instead of doing it on the regular data. Data is de-lagged by removing the data from "lag" days ago thus removing (or attempting to) the cumulative effect of the moving average.
we use alma ma for calculate this script
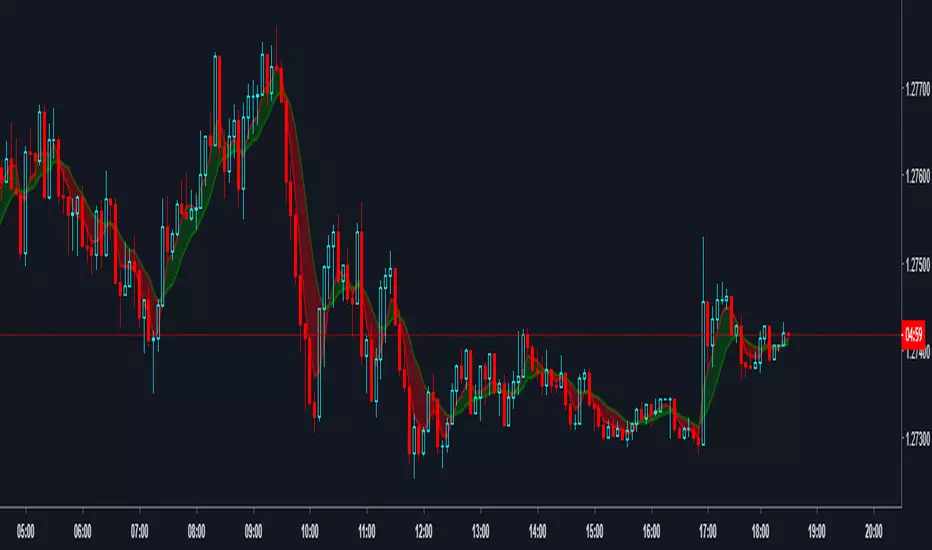
PpSignal Non lag LSMAThe zero lag exponential moving average (ZLEMA) indicator was created by John Ehlers and Ric Way.
As is the case with the double exponential moving average (DEMA) and the triple exponential moving average (TEMA) and as indicated by the name, the aim is to eliminate the inherent lag associated to all trend following indicators which average a price over time.
The formula for a given N-Day period and for a given data series is:
{\displaystyle {\textit {Lag}}={(Period-1)/2}} {\textit {Lag}}={(Period-1)/2}
{\displaystyle {\textit {EmaData}}={Data+(Data-Data(Lagdaysago))}} {\displaystyle {\textit {EmaData}}={Data+(Data-Data(Lagdaysago))}}
{\displaystyle {\textit {ZLEMA}}={EMA(EmaData,Period)}} {\textit {ZLEMA}}={EMA(EmaData,Period)}
The idea is do a regular exponential moving average (EMA) calculation but on a de-lagged data instead of doing it on the regular data. Data is de-lagged by removing the data from "lag" days ago thus removing (or attempting to) the cumulative effect of the moving average.
We use Linear regression ma for calculate this script

MTF Deviation (on-chart) - Mtrl_ScientistHey everyone,
This is an on-chart version of my previous MTF Deviation indicator:
I've added more fib levels and you can now easily see the support/resistance price levels.

Crypto Mineable vs Not Mineable (Market Caps Ratio)Hello traders!
This indicator shows you the ratio between market capitalizations of the mineable and not mineable cryptocurrencies from TOP-20 (excluding Bitcoin Cash).
NOTE : The market capitalizations are calculated dynamically . The word "dynamically" means that I did not hardcode supplies for presented cryptocurrencies.
What else is included
Alert for the specified positive % change
Alert for the specified negative % change
How to get access
Buy for only 25$ to get lifetime access to this indicator
Like and follow for more cool indicators!
Happy Trading!

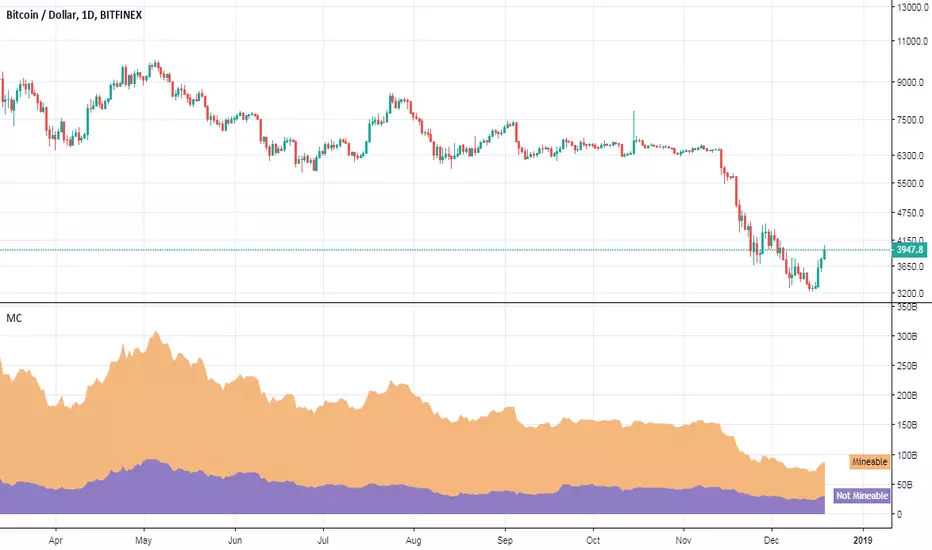
Crypto Mineable vs Not Mineable (Market Caps)Hello traders!
This indicator shows you the dynamic market capitalization charts of the mineable and not mineable cryptocurrencies from TOP-20 (excluding Bitcoin Cash).
NOTE : The word "dynamic" means that I did not hardcode supplies for the presented cryptocurrencies.
How to get access
Buy for only 25$ to get lifetime access to this indicator
Like and follow for more cool indicators!
Happy Trading!
PpSignal The Ultimate Moving Average CrossoverNo matter how many times I explore new concepts, I tend to always incorporate a moving average, or two (if not on price, then on an oscillator). I am going to show the settings I have found to be most beneficial for finding the trend for the ES, forex, crypto etc. First, I have to admit, it is not just a simple crossover. Instead, it is a combination of a MA cross, Multi-Time Frame (MTF), and direction of a normalized moving average.
Crypto Correlation Matrix Series [SHK]Hi everyone, Although everything's clear from the title but I should describe some basic points.
Currency Correlation is a statistical measure of how two securities move in relation to each other.
So this script is used to show if current pair (alt-coins) is moving in the same direction of bitcoin (or ethereum) or not. Consider that in crypto market most of alt-coins have correlation of +0.7 with bitcoin, So temporary changes in correlation may signal a reversal or sharp continuation for the alt-coin.
"1" : The alt coin is moving in same direction of Bitcoin (Or Ethereum).
"0" : The alt coin is moving in random direction compared to Bitcoin. (No movement relation)
"-1" : The alt coin is moving in opposite direction of Bitcoin.
Important Note: By default average of 15 bars back is measured to calculate the correlation by this script. Please test other periods and share the best options with us.
Comments are welcomed :)