KIMSHA AIODescription
The KIMSHA AIO is a comprehensive overlay indicator designed for swing and position traders. It merges three distinct and powerful trading strategies into a single, cohesive tool to identify high-probability setups in stocks that are in confirmed uptrends.
What the Indicator Does:
Combines Three Strategies: Integrates a multi-scanner breakout system, a mean-reversion model, and a multi-year breakout tool into one indicator.
Main Modules
Signals Module:
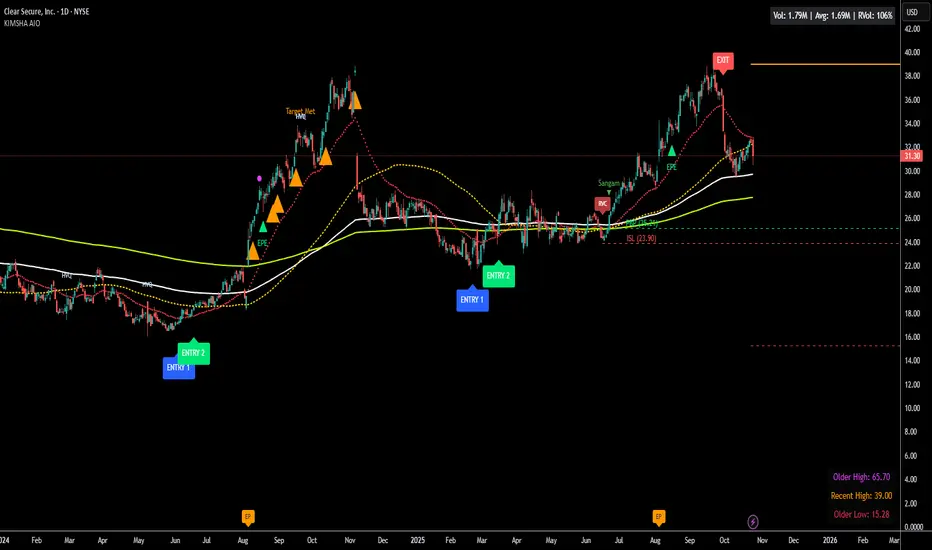
1. Features six unique scanner signals (CS1-CS6) to identify a variety of bullish consolidation patterns.
2. Includes a full trade management framework with RVC (Red Volume Candle), PBP (Post Breakout Pivot Entry), and ISL (Initial Stop Loss) levels.
3. Identifies powerful Episodic Pivot (EP) and EP Entry (EPE) signals for stocks showing exceptional strength.
Reversal Module:
1. A mean-reversion strategy that primarily uses Bollinger Bands to find oversold conditions.
2. Provides a three-stage signal process: RA (Reversal Setup), Entry 1, and Entry 2 to time entries from a potential bottom.
Multi-Year Breakout (MYBO) Module:
1. Automatically identifies and plots historical, multi-year resistance and support levels.
2. Generates a clear signal when the price breaks out above these significant long-term levels.
Advanced Alerts: Features a highly customizable alert system that can be timed to trigger either on the bar's close or at a specific time of day, allowing for end-of-day style notifications.
How to Best Use It:
This indicator is most powerful when used with a systematic, rules-based approach. The core principle is to use long-term moving averages to define the trend and then use the indicator's signals to time entries within that trend.
The Foundation (Trend Filter): The most important rule is to only consider long setups on stocks where the 150-day SMA is above the 200-day EMA, and the 150-day SMA is sloping upwards. This keeps you aligned with the primary uptrend.
Strategy 1: The Momentum Breakout (PBP Entry)
1. Confirm the stock meets the primary trend filter rules.
2. Wait for an AIO setup signal (Super, Pls Buy, etc.) to draw a PBP line.
3. Enter when the price crosses above the PBP line or wait for a pull back after the price has crossed the PBP line.
Strategy 2: The Mean Reversion (RA Entry)
1. Confirm the stock meets the primary trend filter rules.
2. Wait for an "RA" (Reversal Setup) signal to appear on the chart.
3. Enter on the "ENTRY 1" (Risky Entry) or "ENTRY 2" signal (Safer Entry) or wait for a pull back after "ENTRY 1" or "ENTRY 2" signal.
Strategy 3: Multi-Year Breakout (MYBO) :
1. A breakout triangle (orange or fuchsia) appears below the candle, signaling a close above the "Recent High" (Orange) or "Older High" (Fuchsia).
2. Recent High refers to the highest price the stock has reached in last 12 months. Breaking above the "Recent High" is a sign of strong current demand.
3. Older High refers to the highest price the stock reached in a more distant, historical period - the period between 5 years ago and 1 year ago. Breaking above the "Older High" is a sign of VERY strong demand as it has broken a historic high.
4. Wait for a breakout triangle to appear on the chart.
5. Enter on the high of the candle marked with a breakout triangle or wait for a pull back after that signal.
Customize Your View: Use the "Inputs" tab to enable/disable the modules you want to focus on and configure the alerts you want to receive. Use the "Style" tab to hide any visual elements you don't need to keep your chart clean.
Word of Caution: Some signals based on higher timeframes (Monthly, Weekly, 3-Hour) may appear mid-period and could change before the higher timeframe bar closes, due to the settings used for accurate chart alignment.
Contraction
StockLeave Signal BarThe indicator identifies potential trade entries by highlighting expansion and reversal bars. These are defined by individual bar characteristics and refined by contextual factors such as price position relative to structural boundaries. The purpose is to locate bars that could indicate potential market initiation.
Expansion Bars
The expansion captures bars that breakout from a period of reduced volatility. These often initiate directional movement and are recognized using a two-part definition:
Range Expansion The current bar’s range must exceed the average range. This ensures the move is comparatively large and stands out from recent behavior.
Range Compression The bars before the expansion must be below a threshold of the average range. This confirms a low-volatility lead-up, strengthening the likelihood that the expansion has significance.
This script applies additional filters. A local breakout ensures price breaks the previous bar’s high or low. A strong close confirms directional intent by requiring the close near the bar’s extreme. Mean proximity checks that expansion starts near the mean price using a dynamic buffer relative to bar size. A directional filter blocks signals during extended directional runs. Consecutive suppression prevents multiple expansions to show in succession.
Reversal Bars
Reversal setups aim to identify potential turning points after price has reached a zone of imbalance or extension. These bars typically exhibit long tails and occur near structural boundaries such as the outer Keltner bands. Their design favors short-term price rejection and potential reversal.
Tail Dominance The wick must be at least twice the body and make up a significant portion of the bar’s total range, signaling strong rejection rather than indecision.
Close Location The close should be near the opposite end of the wick, near the low for bearish signals and near the high for bullish, confirming pressure in the reversal direction.
This script applies additional filters. Local extreme ensures the bar marks a local turning point to confirm reversals occur after extension, not within structure. Boundary proximity requires the bar to appear near the outer envelope, aligning bearish signals with the upper band and bullish with the lower, indicating price has reached an area of likely imbalance.
This section also incorporate snapback reversals, designed to capture failed extensions beyond structural boundaries. Unlike single-bar rejections, snapbacks use a two-bar sequence: a strong impulse bar that closes outside the envelope, followed by a reversal bar that closes back inside.
Alert Configuration
The Signal Bars indicator includes an alert function with two built-in conditions to help reduce screen time and focus attention when predefined conditions are met.
Expansion: Alerts when a bar meets all conditions for a valid expansion.
Reversal: Alerts when a bar meets the criteria for a pin bar or snapback reversal.
These are built into the indicator with the alertcondition() function and can be turned on whenever the indicator is applied to a chart. Each alert includes a default message that uses dynamic placeholders; {{ticker}} for the symbol and {{interval}} for the timeframe.
Create a new alert and select the condition “StockLeave Signal Bars.”
Then select from the two options: Expansion and Reversal.
For expansions, select “once per bar” to capture developing momentum.
For reversals, use “once per bar close” to confirm rejection setups.
Apply alerts across multiple timeframes to improve coverage. Lower timeframes are better suited for fast-moving markets, while higher timeframes work well in slower or more selective environments. This process only needs to be done once. The created alerts can then be toggled on or off from the Alerts panel as preferred, without requiring reconfiguration.
Applied Discretion
The indicator functions on fixed logic, but interpretation always takes precedence. Consider price action, structure, volatility, and broader market context. Most signals will not lead to trades; while many may appear in a session, only a select few will align with context and warrant execution based on discretion.

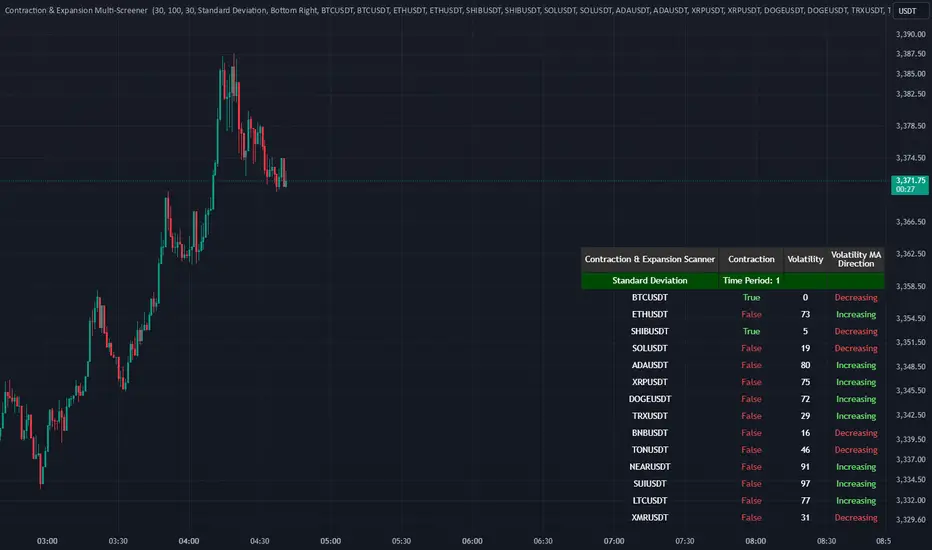
Contraction & Expansion Multi-Screener █ Overview:
The Contraction & Expansion Multi-Screener analyzes market volatility across many symbols. It provides insights into whether a market is contracting or expanding in volatility. With using a range of statistical models for modeling realized volatility, the script calculates, ranks, and monitors the degree of contraction or expansions in market volatility. The objective is to provide actionable insights into the current market phases by using historical data to model current volatility conditions.
This indicator accomplishes this by aggregating a variety of volatility measures, computing ranks, and applying threshold-based methods to identify transitions in market behavior. Volatility itself helps you understand if the market is moving a lot. High volatility or volatility that is increasing over time, means that the price is moving a lot. Volatility also mean reverts so if its extremely low, you can eventually expect it to return to its expected value, meaning there will be bigger price moves, and vice versa.
█ Features of the Indicator
This indicator allows the user to select up to 14 different symbols and retrieve their price data. There is five different types of volatility models that you can choose from in the settings of this indicator for how to use the screener.
Volatility Settings:
Standard Deviation
Relative Standard Deviation
Mean Absolute Deviation
Exponentially Weighted Moving Average (EWMA)
Average True Range (ATR)
Standard Deviation, Mean Absolute Deviation, and EWMA use returns to model the volatility, meanwhile Relative Standard Deviation uses price instead due to its geometric properties, and Average True Range for capturing the absolute movement in price. In this indicator the volatility is ranked, so if the volatility is at 0 or near 0 then it is contracting and the volatility is low. If the volatility is near 100 or at 100 then the volatility is at its maximum.
For traders that use the Forex Master Pattern Indicator 2 and want to use this indicator for that indicator, it is recommended to set your volatility type to Relative Standard Deviation.
Users can also modify the location of the screener to be on the top left, top right, bottom left, or bottom right. You also can disable sections of the screener and show a smaller list if you want to.
The Contraction & Expansion Screener shows you the following information:
Confirmation of whether or not there is a contraction or expansion
Percentage Rank of the volatility
Volatility MA direction: This screener uses moving averages on the volatility to determine if its increasing over time or decreasing over time.
Earning, Sales, and PriceThis Pine Script indicator is designed to visualize and analyze the growth of Earnings Per Share (EPS) and Sales for a given stock over specified time periods. With a user-friendly interface, it allows traders and investors to monitor key financial metrics, helping them make informed decisions based on company performance.
The script presents earnings, sales, and price growth in a clear tabular format directly on the price chart. It features two distinct tables: one for annual data and another for quarterly metrics. For each financial metric, the script calculates and displays growth figures by comparing the current results with either the previous quarter's numbers or the previous year's figures. Additionally, it showcases the stock price along with the corresponding growth between these two data points, providing a comprehensive view of the stock's performance over time.
How to Use:
Typically, growth stocks will rally for a few quarters. However, after significant rallies, the stock needs rest. During this period, the stock will either consolidate or slide down slowly to take support at the key moving average. Importantly, during this time, sales and earnings may continue to grow while the stock is still consolidating.
Typically, after the stock consolidates significantly—even when sales and earnings numbers are increasing—the stock will finally start the next leg of the rally just before the next earnings date or immediately after the earnings report.
For this purpose, the script shows the EPS and sales growth. Additionally, the script displays the price when the previous earnings were declared along with the price growth. This data can be used to find patterns in the stock's behavior. Utilize this indicator to analyze growth patterns and make informed trading decisions based on historical performance and upcoming earnings expectations.
Key Metrics Analyzed:
Earnings Per Share (EPS): Monitors the diluted earnings per share to evaluate company profitability.
Total Revenue: Analyzes sales performance, providing insights into overall revenue generation.
Price Growth: Tracks changes in stock price alongside EPS and sales for comprehensive performance assessment.
Usage:
Ideal for investors and traders looking to evaluate company growth potential and make data-driven decisions.
Use in conjunction with other technical analysis tools for a holistic approach to stock analysis.

Swing Trend AnalysisIntroducing the Swing Trend Analyzer: A Powerful Tool for Swing and Positional Trading
The Swing Trend Analyzer is a cutting-edge indicator designed to enhance your swing and positional trading by providing precise entry points based on volatility contraction patterns and other key technical signals. This versatile tool is packed with features that cater to traders of all timeframes, offering flexibility, clarity, and actionable insights.
Key Features:
1. Adaptive Moving Averages:
The Swing Trend Analyzer offers multiple moving averages tailored to the timeframe you are trading on. On the daily chart, you can select up to four different moving average lengths, while all other timeframes provide three moving averages. This flexibility allows you to fine-tune your analysis according to your trading strategy. Disabling a moving average is as simple as setting its value to zero, making it easy to customize the indicator to your needs.
2. Dynamic Moving Average Colors Based on Relative Strength:
This feature allows you to compare the performance of the current ticker against a major index or any symbol of your choice. The moving average will change color based on whether the ticker is outperforming or underperforming the selected index over the chosen period. For example, on a daily chart, if the 21-day moving average turns blue, it indicates that the ticker has outperformed the selected index over the last 21 days. This visual cue helps you quickly identify relative strength, a key factor in successful swing trading.
3. Visual Identification of Price Contractions:
The Swing Trend Analyzer changes the color of price bars to white (on a dark theme) or black (on a light theme) when a contraction in price is detected. Price contractions are highlighted when either of the following conditions is met: a) the current bar is an inside bar, or b) the price range of the current bar is less than the 14-period Average Daily Range (ADR). This feature makes it easier to spot price contractions across all timeframes, which is crucial for timing entries in swing trading.
4. Overhead Supply Detection with Automated Resistance Lines:
The indicator intelligently detects the presence of overhead supply and draws a single resistance line to avoid clutter on the chart. As price breaches the resistance line, the old line is automatically deleted, and a new resistance line is drawn at the appropriate level. This helps you focus on the most relevant resistance levels, reducing noise and improving decision-making.
5. Buyable Gap Up Marker: The indicator highlights bars in blue when a candle opens with a gap that remains unfilled. These bars are potential Buyable Gap Up (BGU) candidates, signaling opportunities for long-side entries.
6. Comprehensive Swing Trading Information Table:
The indicator includes a detailed table that provides essential data for swing trading:
a. Sector and Industry Information: Understand the sector and industry of the ticker to identify stocks within strong sectors.
b. Key Moving Averages Distances (10MA, 21MA, 50MA, 200MA): Quickly assess how far the current price is from key moving averages. The color coding indicates whether the price is near or far from these averages, offering vital visual cues.
c. Price Range Analysis: Compare the current bar's price range with the previous bar's range to spot contraction patterns.
d. ADR (20, 10, 5): Displays the Average Daily Range over the last 20, 10, and 5 periods, crucial for identifying contraction patterns. On the weekly chart, the ADR continues to provide daily chart information.
e. 52-Week High/Low Data: Shows how close the stock is to its 52-week high or low, with color coding to highlight proximity, aiding in the identification of potential breakout or breakdown candidates.
f. 3-Month Price Gain: See the price gain over the last three months, which helps identify stocks with recent momentum.
7. Pocket Pivot Detection with Visual Markers:
Pocket pivots are a powerful bullish signal, especially relevant for swing trading. Pocket pivots are crucial for swing trading and are effective across all timeframes. The indicator marks pocket pivots with circular markers below the price bar:
a. 10-Day Pocket Pivot: Identified when the volume exceeds the maximum selling volume of the last 10 days. These are marked with a blue circle.
b. 5-Day Pocket Pivot: Identified when the volume exceeds the maximum selling volume of the last 5 days. These are marked with a green circle.
The Swing Trend Analyzer is designed to provide traders with the tools they need to succeed in swing and positional trading. Whether you're looking for precise entry points, analyzing relative strength, or identifying key price contractions, this indicator has you covered. Experience the power of advanced technical analysis with the Swing Trend Analyzer and take your trading to the next level.

Candle Range Detector [UAlgo]The "Candle Range Detector " is a Pine Script™ indicator designed to identify trading opportunities based on the concept of price consolidation and breakout. It analyzes the price range of a specified number of previous candles and detects when subsequent candles stay within that range (consolidation). The indicator then highlights potential breakouts above or below the range and provides calculated Take Profit (TP) and Stop Loss (SL) levels based on your chosen method (percentage or Average True Range - ATR).
🔶 Key Features
Configurable Range: Define the minimum number of candles required to establish a valid price range.
Breakout Detection: Identify potential breakouts above or below the established range based on your selection (close price or wick).
Take Profit & Stop Loss Levels: The indicator calculates TP and SL levels based on your chosen method (percentage or ATR) and user-defined multipliers. The calculated TP and SL levels are visualized as horizontal lines with corresponding labels ("Take Profit" and "Stop Loss").
Optional Count Display: You can choose to display the number of candles currently within the range.
🔶 Disclaimer:
Not Financial Advice: This indicator is intended for educational and informational purposes only. It does not constitute financial advice or recommendations to buy, sell, or hold any financial instruments.
Use at Own Risk: Trading involves substantial risk of loss and is not suitable for all investors. Users of this indicator should exercise caution and conduct their own research and analysis before making any trading decisions.
Performance Not Guaranteed: Past performance is not indicative of future results. While the indicator aims to assist traders in analyzing market trends, there is no guarantee of accuracy or success in trading operations.
🔷 Related Scripts
Range Finder

Master Pattern [UAlgo]🔶 Description:
"Master Pattern by UAlgo" aims to identify and visualize "Master Patterns" in price movements on financial charts, and focusing on detecting liquidity levels and sweeps. The indicator provides users with the ability to customize settings such as master pattern detection and detection flexibility, sensitivity to liquidity levels, and visualization preferences.
🔶 What is the Master Pattern ?
The Master Pattern is a framework built around understanding market cycles, which include three main phases: Contraction, Expansion, and Trend.
Contraction Phase: During this phase, the market fluctuates less and consolidates within a narrow range. Institutional trading volumes tend to be low and it is recommended to avoid trading entries during this period.
Expansion Phase: volatility increases and prices fluctuate greatly. Institutional traders begin to establish positions at this stage and may manipulate prices to attract retail traders to create liquidity for their own buy or sell targets.
Trend Phase: The final phase that completes the market cycle. Institutional traders started taking profits, causing the trend to reverse. This triggered panic among retail traders, leading to liquidations and stop-losses. This creates liquidity from which institutional traders can profit, while retail traders' positions are overvalued.
🔶 Key Features:
Pattern Detection : The indicator detects and visualizes contraction patterns in price movements, helping traders identify potential areas of price consolidation.
Also traders can choose between different modes (Strict, Normal, Relax) for obtaining master patterns, providing flexibility in pattern identification based on individual trading strategies and preferences.
The Value/Expansion Line : This value line is considered by institutional traders as a potential “Point of Origin” for future price movements.
An Application Example of the Master Pattern :
Select the Appropriate Timeframes: A significant separation between the higher timeframe (HTF) and the lower timeframe (LTF) is essential. For instance, combinations like 4H and 15M, 4H and 5M, or 1H and 1M. You can change this according to your own strategy.
Trade Based on Contraction Box, Value Line and Liquidity: When the HTF is above value, look for buying opportunities on your LTF below value. Conversely, when the HTF is below value, seek selling opportunities on your LTF above value. Sweeping liquidity in LTF is also an important parameter.
Also Value/Expansion Line can also be used as Support/Resistance zone,
Liquidity Levels : The indicator includes functionality to detect and display liquidity levels on the chart.
Dashboard Display : A customizable dashboard provides users with key information, including liquidity levels, master pattern values, and whether the current price is above or below Master Pattern's value lines.
Additionally, when liquidity is swept or the price rises above or falls below the value line. this information can be displayed on the dashboard.
Customizable Settings: Users can adjust parameters such as the pattern detection mode, sensitivity to liquidity levels, liquidity type (cumulative or individual for each swing), visualization preferences for master patterns, the position and font size of the dashboard.
🔶 Disclaimer:
Use with Caution: This indicator is provided for educational and informational purposes only and should not be considered as financial advice. Users should exercise caution and perform their own analysis before making trading decisions based on the indicator's signals.
Not Financial Advice: The information provided by this indicator does not constitute financial advice, and the creator (UAlgo) shall not be held responsible for any trading losses incurred as a result of using this indicator.
Backtesting Recommended: Traders are encouraged to backtest the indicator thoroughly on historical data before using it in live trading to assess its performance and suitability for their trading strategies.
Risk Management: Trading involves inherent risks, and users should implement proper risk management strategies, including but not limited to stop-loss orders and position sizing, to mitigate potential losses.
No Guarantees: The accuracy and reliability of the indicator's signals cannot be guaranteed, as they are based on historical price data and past performance may not be indicative of future results.

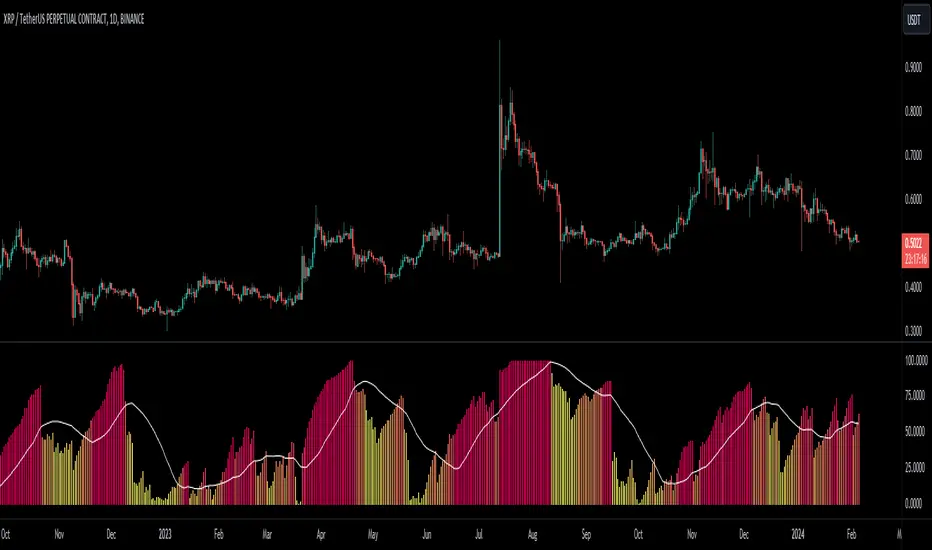
Conditional Volatility PercentileSimple Description: This indicator can basically help you find when a big move might happen ( This indicator can't determine the direction but when a big move could happen. ) Basically, a low-extreme value like 0 means that it only has room for upside, so volatility can only expand from that point on, and the fact that volatility mean reverts supports this.
Conditional Volatility Percentile Indicator
This indicator is a tool designed to view current market volatility relative to historical levels. It uses a statistical approach to assess the percentile rank of the calculated conditional volatility.
The Volatility Calculation
This indicator calculates conditional variance with user-defined parameters, which are Omega, Alpha, Beta, and Sigma, and then takes the square root of the variance to calculate the standard deviation. The script then calculates the percentile rank of the conditional variance over a specified lookback.
What this indicator tells you:
Volatility Assessment: Higher percentile values indicate heightened conditional volatility, suggesting increased market activity or potential stress. Meanwhile, lower percentiles suggest relatively lower conditional volatility.
Extreme Values: Volatility is a mean-reverting process. If the volatility percentile value is at a low value for an extended period of time, you can eventually bet on the volatility percentile value increasing with high confidence.
In financial markets, volatility itself exhibits mean-reverting properties. This means that periods of high volatility are likely to be followed by periods of lower volatility, and vice versa.
1. High Volatility Periods: High volatility levels may be followed by a subsequent decrease in volatility as the market returns to a more typical state.
2. Low Volatility Periods: Periods of low volatility may be followed by an uptick in volatility as the market experiences new information or changes in sentiment.
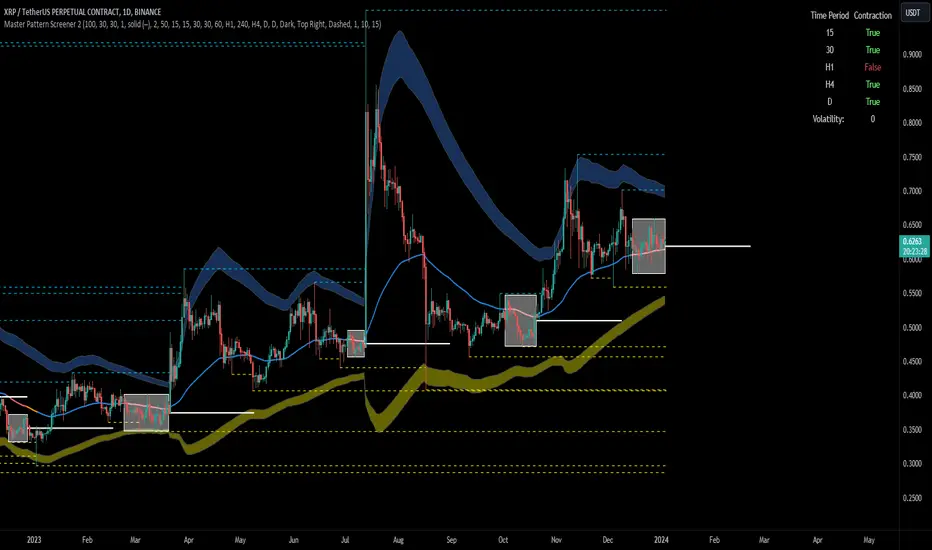
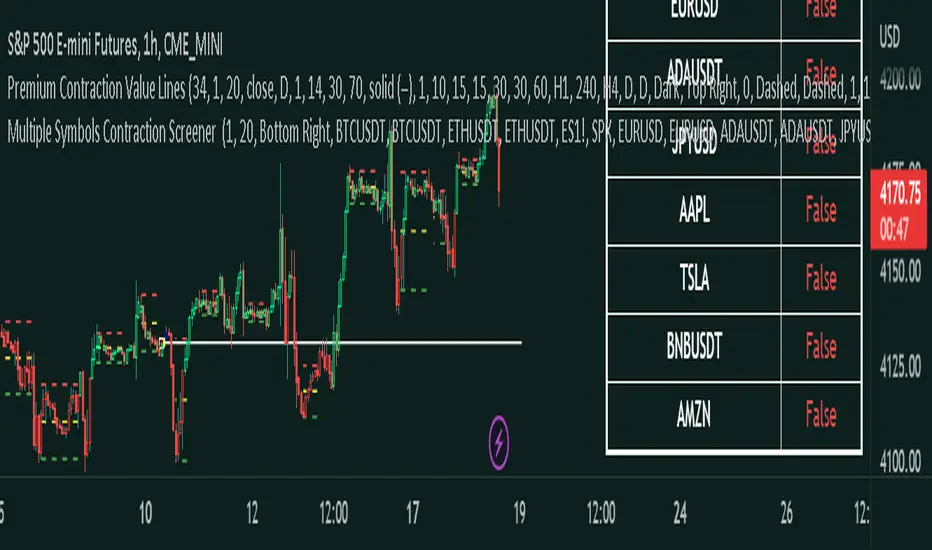
Forex Master Pattern Screener 2Overview
The Forex Master Pattern Screener 2 is based on the Master Pattern, which includes contraction, expansion, and trend phases. This indicator is designed to identify and visualize market volatility, market phases, multi-timeframe contractions, liquidity points, and pivot calculations. It provides a clear image of the market's expansion and contraction phases. It's based on an alternative form of technical analysis that reveals the psychological patterns of financial markets through three phases.
Unlike the other master pattern indicators that just use highs and lows and aren't as accurate for finding contractions, this one uses actual measures of volatility to find extremely low levels of volatility and has customizable parameters depending on what you want to do.
What is the Forex Master Pattern?
The Forex Master Pattern is a framework that revolves around understanding market cycles, comprising the three main phases: contraction, expansion, and trend.
Contraction Phase: During this phase, the market has low volatility and is consolidating within a narrow range. Institutional volume tends to be low, and it's suggested to avoid trade entries during this period.
Expansion Phase: Volatility starts to increase, and there start to be bigger moves in price. Institutional traders start accumulating positions in this phase, and they might manipulate prices to draw in retail traders, creating liquidity for their own buying or selling goals.
Trend Phase: This final phase completes the market cycle. Institutional traders begin taking profits, leading to a reversal. This triggers panic among retail traders, resulting in liquidations and stops. This generates liquidity for institutional traders to profit, leaving retail traders with overvalued positions.
Value Line:
The "value line" acts as the fair value zone or the neutral belief zone where buyers and sellers agree on fair value. It can be likened to the center of gravity and is created during contraction zones.
Applications:
Identifying these phases and understanding the value lines can help traders determine the market's general direction and make better trading decisions.
This isn't a strategy but a concept explaining market behavior, allowing traders to develop various strategies based on these principles
The contractions, which are based on volatility calculations, can help you find out when big moves will occur, known as expansions.
How traders can use this indicator
1. Identifying Market Phases:
Contraction Phase: Look for periods where the market has low volatility and is contracting, indicated by a narrow range and highlighted by the contraction box. During this phase, traders prepare for a breakout but usually avoid making new trades until a clearer trend emerges.
Expansion Phase: When the indicator signals an expansion, it suggests that the market is moving out of consolidation and may be beginning a new trend. Traders might look for entry points here, anticipating a continuation of the trend.
Trend Phase: As the market enters this phase, traders look for signs of sustained movement in one direction and consider positions that benefit from this trend.
2. Multi-Timeframe Analysis:
By looking at multiple timeframes, traders can get a broader view of the market. For instance, a contraction phase in a shorter timeframe within an expansion phase in a longer timeframe might suggest a pullback in an overall uptrend. This indicator comes with a MTF contraction screener that is customizable.
2. Fair Value Lines:
The fair value acts like a "center of gravity.". Traders could use this as a reference point for understanding market sentiment and potential reversal points. This indicator shows these values in the middle of the contraction boxes.
3. Volatility Analysis:
This indicator's volatility settings can help traders understand the market's current volatility state. High volatility indicates a more active market with larger, faster moves, while low volatility might suggest caution and tighter stop-losses or take-profits. If volatility is contracting, then an expansion is imminent. This indicator shows the volatility with percentile ranks in 0-100 values and also alerts you when volatility is contracting, aka the contraction phase.
Volatility Calculations:
This indicator uses a geometric standard deviation to measure volatility based on historical price data. This metric quantifies the variability of price changes over a specified lookback period and then computes a percentile rank within a defined sample period. This percentile calculation helps evaluate the current volatility compared to historical levels.
Based on the percentile rank, the indicator sets thresholds to determine whether the current volatility is within a range considered "contraction" or not. For example, if there are really low levels of volatility on the percentile rank, then there is currently a contraction phase. The indicator also compares the volatility value against a moving average, where values above the current moving average value signal the expansion phase.
Multi-Timeframe Analysis (MTF):
This indicator comes with a multi-timeframe table that shows contractions for 5 different timeframes, and the table is customizable.
Bands:
This indicator comes with bands that are constructed based on the statistical calculations of the standard deviation applied to the log-transformed closing prices. It is commonly assumed that the distribution of prices fits some type of right-skewed distribution. To remove most of the skewness, you can use a log transformation , which makes the distribution more symmetrical and easier to analyze, thus the use of these bands . These bands are in the 2 standard deviation range. You can use these bands to trade at extreme levels. The band parameter is based on the contraction volatility lookback, which is in the Volatility Model Settings tab.
Ways the bands could be used with the contractions:
1. Identifying Breakout trades:
Contraction Zones: These zones indicate periods of low volatility where the market is consolidating. There are usually narrow price ranges, which are considered a build-up phase before a significant price move in any direction.
Bands: When the contraction zone occurs, you might notice the bands tightening around the price on smaller lookback periods, reflecting the decreased volatility. A continuous widening of the bands could then signal the beginning of an expansion phase, indicating a potential breakout opportunity.
2. Enhancing Trade Timing:
Before the Breakout: During the contraction phase, the bands might move closer together, reflecting the lower volatility. You can monitor this phase closely and prepare for a potential expansion. The bands can provide additional confirmation; for instance, a price move toward one of the bands might show an extreme occurrence and might show what the direction of the breakout could be.
After the breakout: Once the price breaks out of the contraction zone and goes to the expansion phase, and if it coincides with the bands widening significantly, it could reinforce the strength and potential sustainability of the new trend, providing a clearer entry.
3. Price-touching bands during a contraction:
If the price repeatedly touches one of the bands during a contraction phase, it might suggest a buildup of pressure in that direction. For example, if the price is consistently touching the upper band even though the bands are narrow, it might suggest bullish pressure that could occur once the expansion phase begin.
4. Price at the band extreme levels during Expansion:
If the price is at the extreme levels of the bands once the expansion phase occurs, it might indicate unsustainable levels and a low probability of the price continuing beyond those levels. Potentially signaling that a reversal will occur. Some trades could use these extremes to place entries during the expansion phases.
Liquidity Levels:
This script comes with liquidity points, whose functionality goes towards identifying pivotal levels in price action, focusing on swing highs and swing lows in the market. These points represent areas where significant buying (for swing lows) or selling (for swing highs) activity has occurred, implying potential levels or resistance in the price movement.
These liquidity points, often identified as highs and lows, are points where market participants have shown interest in the past. These levels can act as psychological indications where traders might place orders, leading to increased trading activity when these levels are approached or breached. When used with the Forex Master Pattern phases, liquidity levels can enhance trades placed with this indicator. For instance, if the market is expanding and approaches a significant liquidity level, there might be a higher chance of a breakout or reversal, showing a possible entry or exit point.
Liquidity Levels in the Contraction Phase:
Accumulation and Distribution: During the contraction phase, liquidity levels can indicate where huge positions are likely accumulating or distributing quietly. If price is near a known liquidity level and in a contraction phase, it might suggest that a large market player is building a position in anticipation of the next move.
Breakout Points: Liquidity levels can also give clues about where price could go after the breakout from the contraction phase. A break above a liquidity level might indicate a strong move to come as the market overcomes significant selling pressure.
Liquidity Levels in Expansion Phase:
Direct Confirmation: As the expansion phase begins, breaking through liquidity levels can confirm the new trend's direction. If the price moves past these levels with huge volume, it might indicate that the market has enough momentum to continue the trend.
Target Areas: Liquidity levels can act as target areas during the expansion phase. Traders using this indicator could look to take profits if the price approaches these levels, possibly expecting a reaction from the market.
Contraction Box & Doji LinesContraction & Doji Lines indicator is designed to identify and visualize potential support and resistance levels on a price chart. It does this by detecting doji candlestick patterns and drawing horizontal lines from the middle of the doji bodies to the right. Additionally, it also highlights price contraction zones with colored boxes.
The indicator first identifies doji candlestick patterns that it suggests indecision in the market, a horizontal line and these horizontal lines can act as potential support or resistance levels. Traders can observe price reactions around these lines. If the price approaches a line and bounces off it, it may indicate a significant level in the market.
In addition to doji lines, this indicator also highlights price contraction zones. When a contraction zone is detected, a colored box is drawn to highlight this zone. The box extends from the fifth bar ago (left side) to the current bar (right side), with the highest high and lowest low of the identified zone. The color and width of this box can be customized using the "Box Line Border Color," "Box Background Color," and "Box Width" parameters.
A possible strategy could be can use the doji lines as potential support and resistance levels to make trading decisions. For example, if the price breaks above a doji line and holds, it may indicate a bullish signal.
The colored boxes highlight areas of price contraction, which often precede significant price movements. Traders can use these zones to anticipate potential breakouts or breakdowns.
For example, you might enter a long (buy) position if it anticipate a breakout from a contraction zone with a target price set above the breakout level. Conversely, you might enter a short (sell) position if they anticipate a breakdown from a contraction zone with a target price set below the breakdown level.

MAD Volatility PercentileMean Absolute Deviation (MAD) is a statistical measure that tells you how spread out or variable a set of data points is. It calculates the average distance of each data point from the mean (average) of the data set. MAD helps you understand how much individual values differ from the average value. It's a way to measure the overall "average distance" of the data points from the center point.
Indicator Overview:
This indicator measures market volatility using Mean Absolute Deviation of returns. The MAD Volatility Percentile Indicator calculates and represents market volatility as a percentile. The lower the percentile, the lower the volatility, and the higher the percentile value is, the higher the volatility is.
Understanding Volatility:
Lower percentiles signify a lower volatility market environment, reflecting reduced volatility, while higher percentiles indicate increased volatility and significant price movements. The indicator also comes with an SMA to see when the burst of higher volatility occur. You can also change the sample length on the indicators option. You can consider a big move occurring when the percentile value is above the SMA.
Application
Generally when the Mean Absolute Deviation Volatility Percentile is low, then this means that the volatility is low and a expansion could happen soon, which means a big move will occur soon. This indicator can also protect you from entering a trade that will not have any significant moves for a while.
This indicator is not a directional indicator but it can be applied with directional indicators, and is extremely versatile. For example you can use it with momentum indicators and if there is low volatility and bullish momentum then this can be a signal to potentially place a long position.
Features:
The percentile length sets the lookback of the percentile which calculates the percentile of the Mean Absolute Deviation of returns.
Sample length: Gets the volatility sample (returns)
SMA Length: The SMA of the percentile. Used to find when a move can be considered as an "expansion"
Alerts: You can also enable color alerts that flash when the volatility is at extremely low levels which can signify that a big move could happen soon.
This is an example of the alerts that the indicator comes with.

Adaptive Momentum Channel - [Volume Filter]The Adaptive Momentum Channel with Volume Filter (Adaptive MCVF) is an indicator that utilizes an adaptive RSI to adjust its sensitivity based on the market conditions. The RSI component of the indicator calculates the standard deviation and mean deviation of RSI values and uses these to calculate the adaptive RSI. The volume filter component of the indicator filters the adaptive RSI based on the volume average, allowing the indicator to identify trend changes and filter out market noise.
The indicator plots the upper and lower bands of the Adaptive MCVF, which are calculated by taking the moving average of the filtered RSI and applying an offset based on the standard deviation. A fast moving average is also plotted, which can be used to identify short-term changes in the trend.
The Adaptive MCVF also includes a divergence identification feature, which can be used to identify potential trend changes. The indicator plots regular bullish and bearish divergences, as well as hidden bullish and bearish divergences.
This is a variant of my previous MCVF indicator, this one simply allows you to take the standard deviation of the momentum and use it to make the indicator a bit more adaptive!
I made it protected to hide the standard deviation math and the auto divergence code.
You can always use this indicator by pressing "favorite";)

Volume Channel - [With Volume Filter]The indicator calculates two volume-weighted moving averages (VWMA) using different lengths, and filters them based on a moving average of volume. The filtered VWMA values are then plotted on the chart as lines, representing the fast and slow moving averages. In addition, upper and lower bands are calculated based on the slow VWMA and plotted as lines on the chart.
The fast and slow VWMA lines can be used to identify trends in the market. When the fast VWMA is above the slow VWMA, it is an indication of an uptrend, and when the fast VWMA is below the slow VWMA, it is an indication of a downtrend. The position of the VWMA lines relative to the upper and lower bands can also be used to identify potential trade signals.
When the price is near the upper band, it indicates that the market is overbought, and when the price is near the lower band, it indicates that the market is oversold. Traders can use these signals to enter or exit trades.
The indicator also includes a volume filter, which means that the VWMA values are only calculated when the volume is above a certain moving average of volume. This helps to filter out noise in the market and provide more accurate signals.
Explanation for each parameter
vwmaLength1: This is the length of the fast volume-weighted moving average (VWMA) used in the calculation. The default value is 10, and it can be adjusted by the user.
vwmaLength2: This is the length of the slow volume-weighted moving average (VWMA) used in the calculation. The default value is 25, and it can be adjusted by the user.
bandLength: This is the length of the moving average used to calculate the upper and lower bands. The default value is 34, and it is not adjustable by the user.
volumeFilterLength: This is the length of the moving average of volume used as a filter for the VWMA calculation. The default value is 5, and it can be adjusted by the user.
src: This is the input source for the VWMA calculation. The default value is close, which means the indicator is using the closing price of each bar. However, the user can select a different input source by changing this parameter.
filteredVwma1: This is the filtered VWMA calculated based on the volume filter and the fast VWMA length. It is plotted as a line on the chart and can be used to identify short-term trends.
filteredVwma2: This is the filtered VWMA calculated based on the volume filter and the slow VWMA length. It is plotted as a line on the chart and can be used to identify long-term trends.
ma: This is the moving average of the filtered slow VWMA values, which is used to calculate the upper and lower bands. It is plotted as a line on the chart.
offs: This is the offset used to calculate the upper and lower bands. It is based on the standard deviation of the filtered slow VWMA values and is multiplied by 1.6185 * 3. It is plotted as a line on the chart.
up: This is the upper band calculated as the moving average plus the offset. It is plotted as a line on the chart and can be used to identify overbought conditions.
dn: This is the lower band calculated as the moving average minus the offset. It is plotted as a line on the chart and can be used to identify oversold conditions.

Matrix Momentum Expansion [IkkeOmar]The indicator consists of several features:
Candlestick chart: The indicator plots a candlestick chart based on the input parameters of the user. The candlesticks are colored blue or orange depending on whether the closing price is above or below the upper and lower bands.
Support and Resistance levels: The indicator also plots support and resistance levels based on the CCI (Commodity Channel Index) of the asset's price. These levels are dynamic and change based on the user's input parameters.
Momentum: The indicator calculates the momentum of the market based on the smoothed and standard deviation of the asset's price. It uses this momentum to calculate upper and lower bands that are plotted on the chart.
Warning signals: The indicator can also be used to identify potential warning signals. When the closing price of the asset moves above the upper band, it could indicate that the market is overbought and a potential reversal could occur. Conversely, when the closing price moves below the lower band, it could indicate that the market is oversold and a potential reversal could occur.
Contractions and expansions in the bands can provide important information to traders about potential price movements.
When the bands contract, it indicates that the market is experiencing low volatility and the price is likely to move sideways. During these periods, traders may look for other signals, such as support and resistance levels or price patterns, to determine potential entry and exit points.
On the other hand, when the bands expand, it indicates that the market is experiencing high volatility and the price is likely to move in a particular direction. Traders can use this information to identify potential trend reversals or continuation patterns. When the upper and lower bands move further apart, it indicates that the trend is becoming stronger, while when they move closer together, it indicates that the trend may be weakening.
When the price moves outside of the bands, it can also provide important information to traders. If the price moves above the upper band, it could indicate that the market is overbought and a potential reversal could occur. Conversely, if the price moves below the lower band, it could indicate that the market is oversold and a potential reversal could occur.
Very important note!
When you see contractions, please understand that it's a wonderful opportunity to pivot into position to catch a good trade because we will see an expansion after!

Momentum Channel - [Volume Filter]The indicator incorporates a volume filter to ensure that the RSI only moves when the volume is above the moving average of the volume.
The filtered RSI is then used to calculate the Bollinger Bands and moving averages, providing insights into the market dynamics.
It also gives you insight into the bigger timeframes so you can monitor momentum!
Volume Filter Length: Input parameter for the length of the volume filter moving average.
Overview of code:
rsiPeriod: Input parameter for the RSI period.
bandLength: Input parameter for the length of the Bollinger Bands.
lengthrsipl: Input parameter for the length of the fast moving average (MA) on the RSI.
volumeFilterLength: Input parameter for the length of the volume filter moving average.
volumeAvg: Calculates the moving average of the volume using the ta.sma() function with the specified volume filter length.
filteredRsi: Uses the ta.valuewhen() function to obtain the RSI value only when the volume is greater than or equal to the volume moving average. This creates a filtered RSI based on the volume filter.
offs: Calculates the offset value for the Bollinger Bands. It is derived by multiplying 1.6185 with the standard deviation of the filtered RSI using the ta.stdev() function.
Master Pattern ScreenerMaster Pattern Screener
This is an indicator based on the concept known as the Forex Master Pattern, which contains three phases. The contraction, expansion, and trend phases This indicator, based on your current timeframe, finds out if there is a contraction on 10 symbols that you can customize to suit your needs.
How does it work?
The indicator is a table, and it finds 10 different symbols on the current timeframe that you have selected. Then it does volume and volatility calculations to determine if a contraction is occurring, which is the first phase and probably the most important phase in the FOREX MASTER PATTERN .
This indicator is meant to be used in conjunction with our contraction plotter. We would have placed this indicator in the contraction and expansion plotter, but there were memory limitation issues, so we placed it in a separate indicator.
How traders can use this indicator
The contraction phase is extremely important because once a contraction is occurring, what always happens is an expansion. Some traders will avoid placing trades in the contraction phase, while others will enter to use the momentum for their trades. This indicator just makes it more convenient to identify the contraction phases.
Examples of the indicator:
Things you should know
The symbols can be customized to whatever you want. You can choose your own stocks, cryptocurrencies, currencies, etc.
Make sure that it's exactly the same; if you use, for example, BTCUSDT Coinbase but check on BTCUSDT Binance, then it may show inaccurate results.
Since this script involves a decent amount of calculations, it may not work properly in low timeframes, like anything less than a minute.
VWMA Volatility OscillatorVWMA Volatility Oscillator
This oscillator uses Volume Weighted Moving Averages to plot the volume. When the average is on the bottom then there is a chance that volatility contractions could be happening and a expansion could happen soon. When the average can be seen "high" like peaking then this could mean that there already is a lot of volume and the expansion is already happening.
What are contractions and expansions?
Contractions are periods in the markets where the price range gets tighter signifying decreasing volatility.
After contractions, Expansions will occur which is a strong movement upwards or downwards and the range increases, which shows an increase in volatility.
How to use this indicator
The indicator has 3 VWMA lines. The indicator also has a bottom range by getting the lowest points of each of the VWMA lines. If the VWMA lines are at the bottom ranges this can signify low volatility and a contraction. This can mean that at any moment a expansion will happen and a possible pump or dump.

Expansion Finder by nnamWhat this Indicator Does
This indicator helps the trader locate expansion and contraction areas in an easy visual way.
When the asset moves from a contraction phase into an expansion phase, the bars change color (customizable). This allows the trader to recognize areas of contraction and avoid trading them. Once a Bar Range moves outside of the average range as specified by the user, the bar will change color informing the trader that the current bar and by default the market, is moving into an expansion phase from a contraction phase.
The indicator works well for those traders that use the Forex Master Pattern to locate Value Lines and Value Areas on the chart giving them an opportunity to draw in these areas with ease.
As shown in the screenshot below, the boxes are manually drawn after the trader locates an easily identifiable area of contraction.
The Indicator makes it easy to find longer areas of contraction and ignore the noise of smaller contractions.
Customizable Settings allow the trader to define the lookback range that determines the number of bars to base the average.
A "multiplier" setting allows the trader to easily adjust the Average by changing the average using a simple calculation.
Example, if the average multiplier is set to "1", the average will be used.
Using the standard average is not always the best way to define these contractions, so traders can set the average to a higher or lower number by using the multiplier, thus changing the calculation but maintaining a consistent number across the chart.
Example: If the average is not plotting the contraction correctly, the trader can manually adjust the multiplier down to 0.5 thus adjusting the average in half or increase the multiplier to 2 thus doubling the average.
As seen in the screenshot below, this changes the number of expansion bars visible on the chart.
Below you can see Value Areas and Value Lines drawn in. These lines assist the trader in defining important levels for future trading.
I hope this Indicator helps you locate value areas and value lines on charts in an easy way.
Any questions or concerns or suggestions, please do not hesitate to reach out.
Happy Trading !!!!
Contraction and Expansion PlotterContraction and Expansion Plotter
Volatility , Contraction, and Expansion Plotter
This indicator is based on the contraction, expansion, and trend phases concept.
I wrote this indicator and optimized it to be user-friendly and show the best value levels in various different timeframes.
The script itself uses Average True Range , WMAs, RSI , and volatility to determine contraction zones and possible expansions.
The contraction phase is the first phase of the market. The script will automatically plot the box, which is the contraction. This is the phase that traders should avoid trading because the value line has yet to be formed. You don't know if the trade will violently go up or down since it is in the next phase.
The expansion is the next phase where high volume and volatility occur. I decided to use RSI crossovers and crossunders to help find the expansion zones since it can be pretty difficult to get a program to recognize them and also since this is the phase where accumulation by the big liquidity players, like the institutions, starts.
The trend phase isn't yet implemented into the script, but basically is when these big liquidity players start taking profits. This is the part where it tends to go back to the value line , even if it is bullish or bearish .
This concept is extremely versatile and can be used to create various different strategies, from long-term strategies to scalping strategies. You can combine this with indicators and not be lost.
To be clear, the boxes are the contraction mapped and the zones you should always avoid trading in.
On timeframes that are hourly and above, the value lines will automatically be plotted by the script.
Some Customization Features:
You can decide different line styles like dotted, solid, dashed, or arrows.
You can also customize the width of the value line but the recommended widths is either 1 or 2.
On default, the value lines retrieved by the contractions will be disabled on timeframes lower than the hourly or daily because it can become unorganized but the option
to enable lower timeframe value lines have been added now.
The value lines will automatically extend until another contraction is present
Option to choose if you want filtered contractions or unfiltered contractions.

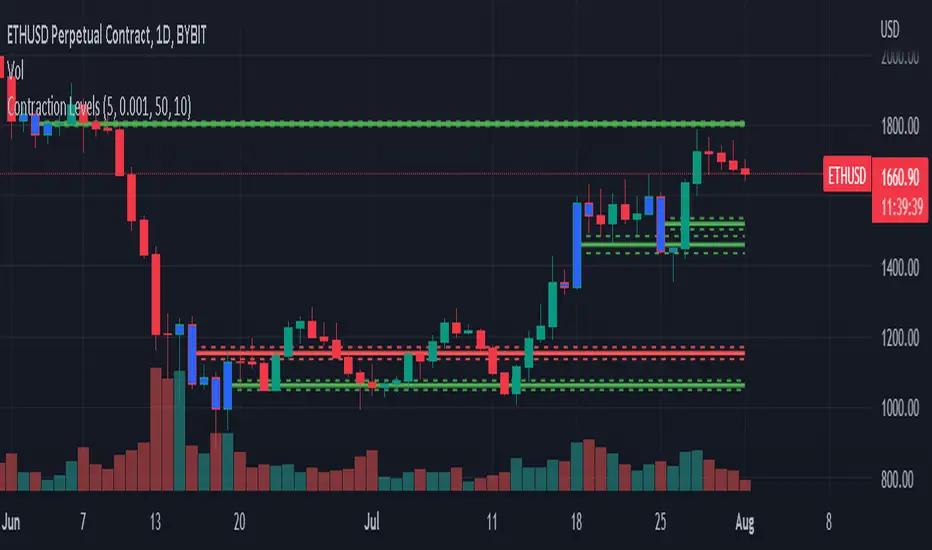
Forex Master Pattern Contraction Finder by nnamThis script is for use with the FOREX Master Pattern to assist the user with drawing in True Value areas.
The script uses a combination of LOWER HIGHS and HIGHER LOWS to pinpoint areas of potential contraction and marks them with an X.
Using these X symbols as visual guidance, the user can easily locate areas of contraction or "tightening" of the price as it comes out of the expansion phase.
In addition, the daily highs and lows create a visible red or green box (depending on price in relation to the previous days close). These boxes also assist the user in determining the average price for the day and whether or not the price is contracting. A WIDE box is indicative of an expansion phase or widening in price swings and a "skinny" box is indicative of a tightening in price swings .
A combination of both plotted X contraction signals and a tightening box are highly indicative of a contraction phase. These contraction phases appear early in the beginning stage of the FOREX MASTER PATTERN giving the user ample time to plan trades and spot breakouts from the contraction into expansion.
The Image above shows a prime example of a potential contraction in price on the ETH/USDT 1 hour chart.
A series of highs and lows shows an expansion. The indicator settings allow the user to turn ON a visual text label showing each higher high, lower high, higher low and lower low in any combination.
Lower High and Higher low is ON by default and is represented by BOTH an X and the initials LH above bar and HL below bar for easier identification of the actual bar that triggered the signal.
In the absence of an X signal or initials LH + HL the contraction is not confirmed. As you can see in the screenshot below, the boxes alone are not indicative of a contraction and can be false positives. It is important to wait for both.
INPUTS AND SETTINGS
To make the indicator more user friendly, I have added several on off buttons for certain attributes. Many are OFF by default for a clean look when firs t starting the indicator. Below is a list of settings and what they are.
Contraction Settings
- Show potential contractions on chart?
on by default - shows the Lower Highs and Lower Lows with an X sumbol
Moving Average Settings
Exponential Moving Average Length
default is 50EMA but can be changed
- Show Moving Average on chart?
off by default and must be checked to add the ema
RSI Settings
- Show RSI Overbought and Oversold?
off by default
Users can turn this on and use in conjunction with higher high and lower high to spot potential reversals
RSI Source - default is CLOSE
RSI Length - default is 6
RSI Overbought Level - default is 85
RSI Oversold Level - default is 15
Chart Type Settings
- Use Renko Style Pivots?
Allows Renko to be used (open/close for high/low)
off by default
LOWER HIGHS AND LOWER LOWS (VIEW BULLISH TRENDS)
Show higher highs?
Show Higher Lows?
These can be turned on or off depending on your preference for trend spotting.
LOWER HIGHS AND LOWER LOWS (VIEW BEARISH TRENDS)
Show Lower Highs?
Show Lower Lows?
These can be turned on or off depending on your preference for trend spotting.
BUY AND SELL SIGNALS SETTINGS
(these are experimental)
- Show Potential BUY signals on chart?
- Show Potential SELL signals on chart?
These 'experimental signals' combine overbought RSI with Higher Highs and Oversold RSI with Lower Lows to signal a potential turn in price.
During major corrections you may get several BUY signals in a row as the price plummets and during FOMO bull runs, you may get several SELL signals in a row.
To help minimize this, you can turn ON the Renko option listed above and change the RSI to a higher number.
The signals work best using Heikin Ashi and on 1 hour time frames.
In order for a trigger to occur, the script ensures there are several RSI overbought and oversold signals in a row.
RSI and Higher High, Lower Low options do not have to be turned on to get the signals.
BOX Settings
You can change the border width and color of the boxes.
You may also JOIN the boxes if you want to.
I really hope you enjoy this indicator and I hope it brings you good luck in your trading.
Don't forget to follow so you are notified when I upload any new indicators.
nnamdert

Contraction LevelsA contraction candle is a candle whose body engulfs both left and right candlesticks' bodies. This indicator shows those contraction candlestick patterns which consists of successive candles. Then draws a horizontal level line to its defined % of its body size and also draws +/- filter lines which are shown as dashed lines, also with an option to define those filters' percentage.
Bullish Contraction:
Whenever a new candle closes above the maximum high of 3 contraction candles pattern, that contraction is called bullish contraction and its lines are shown as green lines ( you can change the color as well)
Bearish Contraction:
Whenever a new candle closes below the maximum low of 3 contraction candles pattern, that contraction is called bearish contraction and its lines are shown as red lines ( you can change the color as well)
Fractal Dimension Index The Fractal Dimension Index is a technical indicator that gauges the amount of volatility currently present in the market.
The theory behind this indicator is that a value of 1.5 suggests the market is acting in a completely random fashion. As the market deviates from 1.5, the opportunity for earning profits is increased in proportion to the amount of deviation.
Keep in mind that the indicator does not show the direction of trends ! Although you can try to test it as a trend-following indicator that gives trend-following signals, that isn't the intended use of the indicator.
The Fractal Dimension Index is red when the market is in a trend. And it is blue when there is high volatility. When the Fractal Dimension Index changes its color from red to blue , it means that a trend is finishing. The market becomes erratic and high in volatility when the Fractal Dimension Index is blue . Usually, these "blue periods" do not go on for a long time, they come before a new trend.
So, look for trend-following signals while the Fractal Dimension Index is blue since this indicates high volatility before a potential trend, and avoid trend-following signals when the Fractal Dimension Index is red since this indicates a ranging/non-trending market or a trend that started long ago.

AR Peti Kemas Candle Cross EMA8 EMA13 EMA21 EMA55 EMA90 EMA200This is implementation of Peti Kemas. Slighly modified for the selection of EMA period, but user can change the period.
The strategy is if the current candle close is below EMA90 and EMA200, the buy signal is generated when the close crosses up EMA13.
When the close above EMA90 and ENA200, then the buy signal is generated when the close crosses up EMA8
