Market Structure Pivots with BOS & CHoCH [zazenio]What is Market Structure?
Market structure is simply the pattern of highs and lows that price creates as it moves. When you look at any chart, you'll notice price doesn't move in a straight line — it swings up, pulls back, swings up again (in an uptrend), or the opposite in a downtrend.
These swing points — the peaks and valleys — are what traders call pivots . Identifying them correctly is the foundation of understanding where a market has been and where it might go next.
What This Indicator Does
Swing Pivots automatically marks these peaks and valleys on your chart so you don't have to draw them manually. It works on any market — stocks, crypto, forex, futures, indices — and on any timeframe.
Beyond just marking pivots, this indicator also draws BOS (Break of Structure) and CHoCH (Change of Character) lines — two essential concepts that help you understand when a trend is continuing or potentially reversing.
How Pivots Are Detected
This indicator confirms pivots based on price structure, not a fixed bar count.
Here's how it works:
A swing high is confirmed when price breaks below the previous swing low. At that moment, we know the high was real — price tried to go higher, failed, and reversed. The market "proved" that level was a genuine turning point.
A swing low is confirmed when price breaks above the previous swing high. The same logic applies — price tried to go lower, failed, and reversed direction.
This creates a natural alternation: high, low, high, low. Each pivot is validated by the market's actual behavior, not by waiting for an arbitrary number of bars to pass.
Understanding BOS and CHoCH
Once you can identify pivots, the next step is understanding what happens when price breaks through them. This is where BOS and CHoCH come in.
BOS (Break of Structure)
A Break of Structure occurs when price continues in the direction of the current trend by breaking a previous pivot level.
In an uptrend : Price breaks above a previous swing high → This signals strength. Buyers are pushing price to new highs, and the trend is likely to continue.
In a downtrend : Price breaks below a previous swing low → This signals weakness. Sellers are pushing price to new lows, and the trend is likely to continue.
Think of BOS as the market saying "the trend is still intact." Each BOS confirms that the dominant side (buyers or sellers) remains in control.
CHoCH (Change of Character)
A Change of Character occurs when price breaks a pivot level in the opposite direction of the current trend. This is an early warning signal that the trend may be reversing.
In an uptrend : Price breaks below a previous swing low → This is unexpected. In a healthy uptrend, lows should hold. When they don't, it suggests buyers are losing control and sellers may be taking over.
In a downtrend : Price breaks above a previous swing high → This is unexpected. In a healthy downtrend, highs should hold. When they don't, it suggests sellers are losing control and buyers may be stepping in.
Think of CHoCH as the market's behavior "changing character" — it's no longer acting the way it should if the trend were healthy.
Why BOS and CHoCH Matter
These concepts give you a framework for reading what the market is actually doing:
BOS tells you the trend is continuing — stay with it or look for entries in that direction
CHoCH warns you the trend may be ending — time to be cautious, take profits, or look for trades in the new direction
By visualizing these breaks directly on your chart, you don't have to guess. You can see at a glance whether the market is trending smoothly (consecutive BOS) or showing signs of reversal (CHoCH).
Why This Approach Works
Most pivot indicators use a "lookback" method — they wait for a certain number of bars (say, 5 or 10) on each side of a candle before confirming it as a pivot. This creates a fixed delay. By the time the pivot appears on your chart, price has already moved on.
This indicator doesn't wait. It confirms pivots the moment price structure proves them. The result is pivots that align with how traders actually read charts — based on breaks of structure, not arbitrary countdowns.
Settings
Configuration
Swing Width : Controls how sensitive the detection is. Higher numbers show only major swings; lower numbers capture smaller moves within the structure.
Pivot Settings
High/Low Color : Customize the colors of swing high and swing low markers
Style : Choose between Triangle or Circle markers
Size : Adjust the size of pivot markers (Auto, Tiny, Small, Normal)
Structure Lines
Show CHoCH : Toggle Change of Character lines on/off
CHoCH Color : Customize the color of CHoCH lines
CHoCH Label : Show/hide the "CHoCH" text label
Show BOS : Toggle Break of Structure lines on/off
BOS Color : Customize the color of BOS lines
BOS Label : Show/hide the "BOS" text label
Use Cases
See the "skeleton" of price action at a glance
Identify potential support and resistance levels
Understand if the market is trending or ranging
Spot trend continuations with BOS lines
Catch early reversal signals with CHoCH lines
Build a foundation for more advanced trading strategies
━━━━━━━━━━━━━━━━━━━━━━
Version History
v1.1
Added BOS (Break of Structure) lines to visualize trend continuation
Added CHoCH (Change of Character) lines to identify potential trend reversals
Added toggle options for BOS and CHoCH visibility
Added customizable colors for structure lines
Added optional labels for BOS and CHoCH
v1.0
Initial release
Automatic swing high and swing low detection
Structure-based pivot confirmation (not fixed lookback)
Customizable pivot markers (style, size, colors)
Adjustable swing width sensitivity
━━━━━━━━━━━━━━━━━━━━━━
Disclaimer:
This script is provided for educational and informational purposes only. It is not financial advice and does not constitute a recommendation to buy or sell any financial instrument. Always do your own research and trade at your own risk.
Choch

Swing Pivots - Market Structure High Low [zazenio]What is Market Structure?
Market structure is simply the pattern of highs and lows that price creates as it moves. When you look at any chart, you'll notice price doesn't move in a straight line — it swings up, pulls back, swings up again (in an uptrend), or the opposite in a downtrend.
These swing points — the peaks and valleys — are what traders call pivots. Identifying them correctly is the foundation of understanding where a market has been and where it might go next.
What This Indicator Does
Swing Pivots automatically marks these peaks and valleys on your chart so you don't have to draw them manually. It works on any market — stocks, crypto, forex, futures, indices — and on any timeframe.
How Pivots Are Detected
This indicator confirms pivots based on price structure, not a fixed bar count.
Here's how it works:
A swing high is confirmed when price breaks below the previous swing low. At that moment, we know the high was real — price tried to go higher, failed, and reversed. The market "proved" that level was a genuine turning point.
A swing low is confirmed when price breaks above the previous swing high. The same logic applies — price tried to go lower, failed, and reversed direction.
This creates a natural alternation: high, low, high, low. Each pivot is validated by the market's actual behavior, not by waiting for an arbitrary number of bars to pass.
Why This Matters
Most pivot indicators use a "lookback" method — they wait for a certain number of bars (say, 5 or 10) on each side of a candle before confirming it as a pivot. This creates a fixed delay. By the time the pivot appears on your chart, price has already moved on.
This indicator doesn't wait. It confirms pivots the moment price structure proves them. The result is pivots that align with how traders actually read charts — based on breaks of structure, not arbitrary countdowns.
Settings
Swing Width: Controls how sensitive the detection is. Higher numbers show only major swings; lower numbers capture smaller moves within the structure.
Style/Size/Colors: Customize how the pivot markers look on your chart.
Use Cases
See the "skeleton" of price action at a glance
Identify potential support and resistance levels
Understand if the market is trending or ranging
Build a foundation for more advanced concepts like Break of Structure (BOS) and Change of Character (CHoCH)
⸻
Disclaimer:
This script is provided for educational and informational purposes only. It is not financial advice and does not constitute a recommendation to buy or sell any financial instrument. Always do your own research and trade at your own risk.

SMC + OB + FVG + Reversal + UT Bot + Hull Suite – by Fatich.id🎯 7 INTEGRATED SYSTEMS:
✓ Mxwll Suite (SMC + Auto Fibs + CHoCH/BOS)
✓ UT Bot (Trend Signals + Label Management)
✓ Hull Suite (Momentum Analysis)
✓ LuxAlgo FVG (Fair Value Gaps)
✓ LuxAlgo Order Blocks (Volume Pivots) ⭐ NEW
✓ Three Bar Reversal (Pattern Recognition)
✓ Reversal Signals (Momentum Count Style)
⚡ KEY FEATURES:
• Smart Money Structure (CHoCH/BOS/I-CHoCH/I-BoS)
• Auto Fibonacci (10 customizable levels)
• Order Block Detection (Auto mitigation)
• Fair Value Gap Tracking
• Session Highlights (NY/London/Asia)
• Volume Activity Dashboard
• Multi-Timeframe Support
• Clean Label Management
🎨 PERFECT FOR:
• Smart Money Concept Traders
• Order Flow & Liquidity Analysis
• Support/Resistance Trading
• Trend Following & Reversals
• Multi-Timeframe Analysis
💡 RECOMMENDED SETTINGS:
Clean Charts: OB Count 3, UT Signals 3, FVG 5
Detailed Analysis: OB Count 5-10, All Signals
Scalping: Low sensitivity, Hull 20-30
Swing Trading: High sensitivity, Hull 55-100

FX OSINT - Institutional Midnight Intelligence For ForexFX OSINT — Institutional Midnight Intelligence For Forex
See Your FX Charts Like an Intelligence Briefing, Not a Guess
If you’ve ever stared at EURUSD or GBPJPY and thought:
Where is the real liquidity?
Is this move sponsored by smart money or just noise?
Am I buying into premium or discount?
…then FX OSINT is designed for you.
FX OSINT (Forex Open Source Intelligence) treats the FX market the way an analyst treats an investigation:
Collect open‑source signals from price, time, and volatility.
Map out liquidity, structure, and sessions in a repeatable way.
Present them in a clean, non‑cluttered dashboard so you can read context quickly.
No rainbow spaghetti. No 12 indicators stacked on top of each other. Just structured information, midnight visuals, and a clear read on what the market is doing right now.
Why FX OSINT Exists
Many FX traders run into the same problems:
Overloaded charts – multiple indicators fighting for space, none talking to each other.
Signals with no context – arrows that ignore structure, sessions, and liquidity.
Tools not tuned for FX – generic indicators that don’t care what pair you are on.
FX OSINT brings this together into one FX‑focused framework that:
Understands structure : BOS/CHOCH, swings, and trend across multiple timeframes.
Respects liquidity : sweeps, order blocks, and FVGs with controlled visibility.
Reads volatility & ADR : how far today’s range has developed.
Knows the clock : London, New York, and key killzones.
Scores confluence : a 0–100 engine that summarizes how much is lining up.
FX OSINT is built for traders who want structured, institutional‑style logic with a disciplined, midnight‑themed UI —not flashing buy/sell buttons.
1. Midnight Dashboard — Top‑Right Intelligence Panel
This panel acts as your compact “situation room”:
CONFLUENCE — 0–100 score blending trend alignment, volatility regime, sessions, liquidity events, order blocks, FVGs, and ADR context.
REGIME — Low / Building / Normal / Expansion / Extreme, driven by ATR relationships, so you know if you’re in chop, trend, or expansion.
HTF / MTF / LTF TREND — Higher‑, medium‑, and current‑timeframe bias in one place, so you see if you are trading with or against the larger flow.
ADR USED — How much of today’s typical range has already been consumed in percentage terms.
PIP VALUE — Approximate pip size per pair, including JPY‑style pairs.
Everything is bold, legible, and color‑coded, but the layout stays minimal so you can:
Look once → understand the context.
2. Structure, BOS, CHOCH — Smart‑Money‑Style Skeleton
FX OSINT tracks swing highs and lows, then shows how structure evolves:
Trend logic based on evolving swings, not just a moving average cross.
BOS (Break of Structure) when price expands in the direction of trend.
CHOCH (Change of Character) when behavior flips and the market structure changes.
Labels are selective, not spammy . You don’t get a tag on every minor wiggle—only when structure meaningfully shifts, so it’s easier to answer:
"Are we continuing the current leg, or did something actually change here?"
3. Liquidity Sweeps, Order Blocks & FVGs — The OSINT Layer
FX OSINT treats liquidity as a key information layer:
Liquidity sweeps — Detects when price spikes through recent highs/lows and then snaps back, flagging potential stop runs.
Order blocks — The last opposite candle before a displacement move, drawn as controlled boxes with limited lifespan to avoid clutter.
Fair Value Gaps (FVGs) — Three‑candle imbalances rendered as precise zones with a cap on how many can exist at once.
Under the hood, boxes are managed so your chart does not become a wall of old zones:
// Draw Order Blocks with overlap prevention
if isBullishOB and showOrderBlocks
if array.size(obBoxes) >= maxBoxes
oldBox = array.shift(obBoxes)
box.delete(oldBox)
newBox = box.new(bar_index , low , bar_index + obvLength, high ,
border_color = bullColor, bgcolor = bullColorTransp,
border_width = 2, extend = extend.none)
array.push(obBoxes, newBox)
Box limits keep the number of zones under control.
Borders and transparency are tuned so you still see price clearly.
You end up with a curated liquidity map , rather than a chart buried under every level price has ever touched.
4. Volatility, ADR & Sessions — Time and Range Intelligence
FX OSINT runs a Volatility Regime Analyzer and an ADR engine in the background:
Volatility regime — Five states (Low → Extreme) derived from fast vs. slow ATR.
ADR bands — Daily high/mid/low projected from the current daily open.
ADR used % — How far today’s move has traveled relative to its typical range.
On the time side:
Asia, London, New York sessions are softly highlighted with a single active background to avoid overlapping colors.
Killzones (e.g., London and New York opens) can be emphasized when you want to focus on where significant moves often begin.
Together, this helps you answer:
"What time is it in the trading day?"
"How stretched are we?"
"Is expansion just starting, or are we late to the move?"
5. ICT‑Style Add‑Ons — BOS/CHOCH, Premium/Discount, and Confluence
For modern FX / ICT‑inspired workflows, FX OSINT includes:
BOS / CHOCH labels — Clear structural shifts based on swings.
Premium / Discount zones — 25%, 50%, 75% levels of the daily range, so you know if you are buying discount in an uptrend or selling premium in a downtrend.
Confluence score — A single number summarizing how many conditions line up in the current context.
Instead of replacing your plan, FX OSINT compresses your checklist into the chart:
Structure
Liquidity
Session / Time
Volatility / ADR
Higher‑timeframe alignment
When these agree, the dashboard reflects it. When they don’t, it stays neutral and lets you see the conflict.
How To Use FX OSINT
FX OSINT is not a signal bot. It is an information engine that organizes context so you can apply your own plan.
A typical workflow might look like:
Start on higher timeframes (e.g., H4/D1) to form directional bias from structure, volatility regime, and ADR context.
Move to intraday timeframes (e.g., M15/H1) around your chosen sessions (London and/or New York).
Look for confluence :
HTF / MTF / LTF trends aligned.
Price in discount for longs or premium for shorts.
Recent liquidity sweep into a meaningful OB or FVG.
Confluence score at or above a level you consider significant.
Then refine entries using BOS/CHOCH on lower timeframes according to your own risk and execution rules.
FX OSINT aims to make sure you do not enter a trade without seeing:
Where you are in the day (ADR and sessions).
Where you are in the volatility cycle (regime).
Who currently appears in control (structure and trend).
Which liquidity was just targeted (sweeps and zones).
Design Choices and Scope
FX OSINT was designed around a few clear constraints:
FX‑focused — Logic and filters tuned for FX majors, minors, exotics, and metals. It is intended for FX markets, not for every possible asset class.
Open‑source — The full Pine Script code is available so you can read it, learn from it, and adapt it to your own workflow if needed.
Clear themes — Two main visual styles (e.g., dark institutional “midnight” and a lighter accent variant) with a focus on readability, not visual noise.
Chart‑friendly — Panels use fixed areas, session highlights avoid overlapping, and boxes are capped/pruned so the chart remains usable.
FX OSINT is for only Forex pairs, not anything else!
Hope you enjoyed and remember your Open Source Intelligence Matters 😉!
-officialjackofalltrades

Structure Breakout - Buy Sell IndicatorStructure Breakout - Buy Sell Indicator
📈 OVERVIEW:
A minimalist indicator that identifies market structure breakouts using swing point analysis.
Displays clear blue buy arrows and red sell arrows when price breaks key swing levels.
🔧 HOW IT WORKS:
1. Identifies swing highs and lows using configurable lookback period
2. Triggers BUY signal (blue arrow) when price closes above previous swing high
3. Triggers SELL signal (red arrow) when price closes below previous swing low
4. Uses clean visual arrows without cluttering the chart
⚙️ KEY FEATURES:
• Clean, uncluttered visual signals
• Customizable sensitivity period
• Blue arrows for buy signals (below bars)
• Red arrows for sell signals (above bars)
• No lagging repainting
• Works on all timeframes
🎯 TRADING APPLICATIONS:
• Swing trading entries
• Breakout confirmation
• Trend continuation signals
• Support/resistance breaks
⚡ SETTINGS:
• Structure Detection Period (default: 20) - Adjust sensitivity of swing detection
⚠️ RISK DISCLAIMER:
This is an educational tool. Always use proper risk management.
Past performance does not guarantee future results.

ICT Concept MTF Scanner [Elykia]ICT Concept MTF Scanner
Overview
The ICT Concept MTF Scanner is the ultimate productivity dashboard for traders using SMC (Smart Money Concepts) and ICT methodologies.
Stop switching tabs constantly. This indicator allows you to monitor the market structure (Trend, BOS, CHoCH) of 20 different assets simultaneously, each with its own custom timeframe.
It also overlays the structural points and Premium/Discount zones directly on your current chart.
Key Features:
📊 Multi-Asset Dashboard: Monitor up to 20 symbols (Indices, Forex, Crypto, Metals) in a single, fully customizable table.
clock: Individual Timeframes: Unlike standard screeners, you can set a different timeframe for each ticker (e.g., NQ on 15m, ES on 1h, DXY on 4h).
🧠 Auto-Structure Detection:
BOS (Break of Structure): Trend continuation.
CHoCH (Change of Character): Trend reversal signal.
SMS (Shift in Market Structure): Failure swing.
⚖️ Premium & Discount Zones: Automatically calculates buying (Discount) and selling (Premium) zones based on the Active or Previous range.
🔔 Smart Alerts: Get notified on structural changes or when price enters a Premium/Discount zone.
How to use:
1. Ticker Setup: In the settings, select your favorite assets and assign the specific timeframe you want to monitor for each.
2. Sensitivity (Structure): Adjust the "Period" (Pivot Length). A lower value (e.g., 3-5) detects minor structure, while a higher value (e.g., 10-20) reveals the macro trend.
3. Reading the Table:
Teal: Bullish Structure.
Red: Bearish Structure.
Signal: Shows the most recent structural event (BOS or CHoCH).
Disclaimer :
This indicator is for educational and informational purposes only. Past performance does not guarantee future results. Trade at your own risk.

Smart Money Toolkit - PD Engine Bias Map [KedArc Quant]Description
Smart Money is an advanced multi-layer Smart Money Concepts framework that automatically detects structure shifts, premium-discount zones, and institutional order flow.
It is built around the PD Engine, which calculates the midpoint of the most recent market swing and dynamically determines BUY or SELL bias based on where current price trades relative to that equilibrium. This toolkit visualizes structure, order blocks, and bias context in one clean map, giving traders an institutional-grade view without unnecessary signal clutter.
Why It Is Unique
- All CHoCH, BOS, Order Block, FVG, and PD logic are coded from scratch.
- Uses true equilibrium (50 percent PD midpoint) for dynamic bias.
- Optimized for stability and non-repainting behavior.
- Designed for clarity with minimal, performance-safe visuals.
Entry and Exit Logic (Discretionary Framework)
- This toolkit is not a signal generator. It provides market context that guides discretionary trading.
BUY Bias (Discount Zone)
- Price trades below PD Mid: the market is in discount.
- Wait for a bullish CHoCH or reaction from a demand OB or FVG before buying.
- Target 1 = PD Mid. Target 2 = next opposite OB or FVG.
SELL Bias (Premium Zone)
- Price trades above PD Mid: the market is in premium.
- Wait for a bearish CHoCH or reaction from a supply OB or FVG before shorting.
- Target 1 = PD Mid. Target 2 = next opposite OB or FVG.
Institutional concept sequence: Bias → Structure Shift → Confirmation → Execution.
Input Configuration
Swing Sensitivity - Determines how far back to identify HH and LL pivots.
OB / FVG Detection - Toggles visual Order Block or Fair Value Gap zones.
PD Engine - Shows PD midpoint line, zone shading, and bias table.
Multi-TF Bias Sync - Optionally reads a higher timeframe bias for confirmation.
Color Themes - Switch between light, dark, or institutional palettes.
Formula / Logic Summary
Concept Formula
PD Mid (Equilibrium) (Recent Swing High + Recent Swing Low) / 2
BUY Bias close < PD Mid
SELL Bias close > PD Mid
CHoCH / BOS Pivot-based structure reversal: HH→LL or LL→HH
Order Block Last bullish or bearish candle before displacement.
FVG Gap between prior candle high/low and next candle range.
These formulas follow the structure used in institutional Smart Money Concepts.
How It Helps Traders
- Shows institutional premium and discount zones visually.
- Defines clear directional bias before entry.
- Combines structure, order blocks, FVG, and equilibrium in one layout.
- Works on any timeframe or asset.
- Prevents emotional trades by giving objective bias context.
Glossary
PD Mid Midpoint between recent swing high and low (market fair value).
Premium Zone Price above PD Mid; sellers control.
Discount Zone Price below PD Mid; buyers control.
CHoCH Change of Character, first reversal signal.
BOS Break of Structure, trend continuation confirmation.
OB Order Block, last institutional candle before move.
FVG Fair Value Gap, price imbalance often revisited.
FAQ
Q: Is this a signal indicator?
A: No. It is a contextual framework that supports manual decision-making.
Q: Does it repaint?
A: No. All structure logic is confirmed on bar close.
Q: Does it work on all markets?
A: Yes. It is purely price-based and timeframe independent.
Q: When does bias change?
A: Only after a new confirmed swing high or low.
Q: Can it be backtested?
A: You can build strategies on top of this context using your own entry and exit rules.
Disclaimer
This script is provided for educational purposes only.
It is not financial advice.
Trading carries risk. Past performance does not guarantee future results.
Use proper risk management and test on demo accounts before applying to live markets.

BOS and CHoCHThe market never moves in a straight line. It moves in waves.
It makes a High, comes down a bit (Low), then breaks the previous High to make a new High.
Similarly, It makes a Low, goes up a bit (High), then breaks the previous Low to make a new Low.
BOS (Break Of Structure) - Trend Continuation
BOS means the market is continuing its current trend. If the market is in an Uptrend and breaks the old "High" -> Bullish BOS. If the market is in a Downtrend and breaks the old "Low" -> Bearish BOS.
3. CHOCH (Change Of Character) - Trend Reversal
CHOCH means the mood of the market has changed. For the first time, the trend has shifted its nature.
Bullish to Bearish CHOCH: The market was making Higher Highs, but suddenly it broke its previous "Low". Now the market can fall.
Bearish to Bullish CHOCH: The market was falling (Lower Lows), but suddenly it broke its previous "High". Now the market can rise.
BOS: Confirms the trend (Breaking the ceiling to go higher).
CHOCH: Signals a trend change (Slipping and falling below the previous floor).

SMC Trend Reversal by Pooja🌟 SMC Trend Reversal by Pooja — CHoCH + BOS + RSI Confirmation
🔥 Smart Money Concepts • Trend Reversal Detection • Multi-Asset Optimized
The SMC Trend Reversal by Pooja is a powerful market-structure indicator designed for traders who follow Smart Money Concepts (SMC) and want to identify trend reversals, BOS, and CHoCH with high clarity.
It blends pivot-based structure breaks, RSI confirmation, and an optional session filter, giving traders a clean and reliable view of market shifts across Crypto, Forex, Indices, and Equity Derivatives.
✨ 🔰 Why SMC Matters in Crypto & Forex?
Both Crypto and Forex markets:
Trade 24/7 / 5 days with high volatility
React strongly to liquidity zones, market structure shifts, and smart money footprints
Often reverse sharply after liquidity grabs
Follow clean CHoCH → BOS → Trend progression sequences
This is why CHoCH (Change of Character) and BOS (Break of Structure) are crucial tools used by professional SMC traders to catch early trend reversals.
This indicator automates that process for you.
No clutter. No repaints. No noise.
Just pure SMC structure.
🚀 Key Features
🟣 CHoCH Detection (Change of Character)
Detects when the market shifts direction
A CHoCH appears when the trend flips from down → up or up → down
Highlights the earliest sign of a trend reversal
Draws a clean CHoCH line across structure
Works beautifully in volatile markets like Crypto & Forex
🔵 BOS Detection (Break of Structure)
Identifies structural continuation in the same direction
Helps confirm the new trend after CHoCH
Clear BOS lines to visualize progression of market flow
Ideal for trend-following and breakout traders
🧠 RSI-Based Confirmation (Optional)
To avoid fake CHoCH signals, the indicator uses RSI filtering:
RSI > Upper Level → Show “B” Buy Label
RSI < Lower Level → Show “S” Sell Label
This improves accuracy especially in:
Fast crypto markets (BTC, ETH, SOL etc.)
Liquidity-driven assets (Forex, Indices)
⏱️ Session Block (Asia/Kolkata Compatible)
Avoid signals in the first few minutes of market open or in volatile windows.
Block signals in a selected time range
Perfect for Indian market opening volatility (09:00–09:25)
🎯 Clean, Minimal, Easy-to-Read Visuals
✔ Horizontal structural lines
✔ Color-coded CHoCH and BOS
✔ Buy (B) / Sell (S) labels only when meaningful
✔ No unnecessary clutter
✔ Suitable for both beginners and advanced SMC traders
📢 Built-In Alerts
Receive notifications for:
🔔 Bullish CHoCH
🔔 Bearish CHoCH
🔔 Bullish BOS
🔔 Bearish BOS
Perfect for mobile, desktop, and webhook automation.
📈 How It Helps Your Trading
✔ Catch early trend reversals with confidence
✔ Avoid false signals with RSI filtering
✔ Trade like Smart Money (Institutional concepts)
✔ Works on all timeframes — scalping to swing
✔ Specially powerful on Crypto & Forex due to their structure-driven nature
✔ Cleaner charts → Better decisions → Higher probability trades
🧩 Who Should Use This Indicator?
✔ SMC / ICT style traders
✔ Breakout and trend-following traders
✔ Reversal traders
✔ Crypto & Forex scalpers
✔ Option buyers looking for early trend shifts
✔ Intraday NIFTY / BANKNIFTY traders
⚠️ Disclaimer
This indicator is for educational purposes and market analysis only.
It does not guarantee profits. Always practice risk management and test your settings before using it live.

Scalper Pro Pattern Recognition & Price Action📘 Scalper Pro Pattern Recognition & Price Action
Overview
Scalper Pro is a dynamic multi-layer trend recognition and price action strategy that integrates Supertrend, Smart Money Concepts (SMC), and volatility-based risk control.
It adapts to market volatility in real time to enhance entry precision and optimize risk.
⚠️ This script is for educational and research purposes only.
Past performance does not guarantee future results.
🎯 Strategy Objectives
Detect structural market shifts (BOS / CHoCH) automatically.
Identify Order Blocks (OB), Fair Value Gaps (FVG), and key liquidity zones.
Plot dynamic Take-Profit (TP) and Stop-Loss (SL) levels based on ATR.
Avoid low-volatility (sideways) conditions using ADX filtering.
Combine trend-following signals with structural confirmation.
✨ Key Features
Supertrend Entry Signals — Generates precise buy/sell markers based on price crossovers with the Supertrend line.
Order Block Detection — Automatically plots both Internal and Swing Order Blocks for smart money insights.
Fair Value Gap Visualization — Highlights inefficiency zones in bullish or bearish structures.
Market Structure Labels — Marks Break of Structure (BOS) and Change of Character (CHoCH) points for clear trend shifts.
Dynamic Risk Levels — Automatically generates TP/SL lines and price labels using ATR-based distance.
📊 Trading Rules
Long Entry:
• Price crosses above the Supertrend (ta.crossover(close, supertrend))
• ADX above sideways threshold (trend condition confirmed)
• Optional confirmation from a bullish BOS or CHoCH
Short Entry:
• Price crosses below the Supertrend (ta.crossunder(close, supertrend))
• ADX above threshold
• Optional confirmation from a bearish BOS or CHoCH
Exit (or Reverse):
• Opposite Supertrend crossover
• Price hits TP/SL lines
• Trend shift confirmed by internal BOS/CHoCH
💰 Risk Management Parameters
Stop Loss & Take Profit based on ATR × risk multiplier
ATR Length: 14 (default)
Risk %: 3% per trade
Sideways Filter: ADX < 15 → no trade zone
TP1–TP3 = Entry ± (ATR × 1~3)
⚙️ Indicator Settings
Supertrend Module:
ATR Length: 10
Factor: nsensitivity × 7
ADX Module:
ADX Length: 15
Sideways Threshold: 15
EMA Set:
EMA (5, 9, 13, 34, 50) × Volatility Factor (3)
SMA Filter:
SMA(8) & SMA(9) for short-term trend confirmation
Smart Money Concepts Module:
Displays BOS/CHoCH, Order Blocks, FVGs, Equal Highs/Lows, and Premium/Discount zones
🔧 Improvements & Uniqueness
Integrates Supertrend momentum with Smart Money Concepts (SMC) structural analysis.
Dual detection layers: Internal (micro) and Swing (macro) structures.
ATR-driven auto labeling for entry, stop, and profit targets.
Premium/Discount and Equilibrium zones visualized on the chart.
Built-in ADX filter to skip low-trend market conditions.
✅ Summary
Scalper Pro Pattern Recognition & Price Action merges classical trend-following with modern market structure analytics.
It combines momentum detection, volatility control, and smart money mapping into one cohesive framework.
Unified trend, structure, and risk visualization.
Auto-marked BOS/CHoCH, OB, FVG, and liquidity zones.
Usable for scalping, intraday, or swing trading setups.
⚠️ This strategy is based on historical data and designed for educational use only.
Always apply sound risk management and forward testing before live trading.

Smart Risk - Three Institutional Models📘 Smart Risk – Three Institutional Entry Models
A precision-engineered institutional framework that blends liquidity, structure, and multi-time-frame confirmation.
🧠 Concept Overview
The Smart Risk indicator models how institutional traders and algorithms engineer entries around liquidity, imbalance, and structural shifts .
It unifies t hree distinct institutional entry models —each built around core Smart Money Concepts (SMC)—and enhances them with a Multi-Time-Frame Confluence (MTF) engine for directional alignment.
This tool doesn’t simply merge indicators.
It connects l iquidity sweeps, order-block reactions, breaker validation, and fair-value-gap mitigation into one cohesive trading logic—filtering every setup through trend, structure, and volume confirmation.
⚙️ How It Works
Setup #1 – Liquidity Sweep + Order Block Revisit + FVG Mitigation
Identifies engineered stop-hunts where price sweeps external liquidity and returns to a prior Order Block or Fair Value Gap (FVG).
Signals reversal-style entries with high probability of mean-reversion or mitigation.
Setup #2 – Supply/Demand + Mitigation / Breaker / FVG Continuation
Captures continuation trades inside trending structure.
When trend bias (via moving-average context) aligns with breaker or mitigation blocks, signals confirm institutional continuation sequences.
Setup #3 – Sweep + Classic FVG Reaction
Tracks clean displacement gaps following a liquidity sweep—ideal for scalpers and intraday reversals where imbalances act as magnets for price.
Each setup can be independently enabled or disabled from the panel.
A built-in signal-cooldown prevents repetitive triggers on the same leg.
🕒 Multi-Time-Frame Confluence
The new MTF module aligns lower-time-frame precision entries with higher-time-frame market structure.
When enabled, each setup only validates if the HTF trend confirms the same directional bias as the LTF pattern—e.g. a 5-minute bullish FVG signal requires a bullish 1-hour structure.
This ensures institutional logic respects global liquidity flow and avoids counter-trend traps.
MTF Controls:
• ✅ Enable MTF Confluence toggle
• ⏱️ Lower Time-Frame (LTF) selector (default 5 min)
• ⏱️ Higher Time-Frame (HTF) selector (default 1 hour)
• 🔄 Automatic SMA-based HTF trend detection
🎨 Visualization & Dashboard
• Order Block / Supply–Demand Zones — highlight institutional footprints
• Fair Value Gaps (FVGs) — reveal displacement inefficiencies
• Liquidity Sweeps (X / $) — mark engineered stops
• BOS & CHoCH — confirm structure continuation or reversal
• Compact Dashboard — live “Armed” state for each setup and MTF bias
Color-coded background cues emphasize active trade phases without clutter.
🧩 Core Algorithm Highlights
• Dynamic swing and pivot structure detection
• Breaker / Mitigation / Volume confirmation filters
• Fair-Value-Gap logic with directional alignment
• Cooldown control for signal throttling
• Multi-Time-Frame bias filter for contextual precision
⸻
📈 How to Use
1. Apply indicator to any asset or timeframe.
2. Select which institutional setups you want active.
3. Optionally enable MTF Confluence (5 min → 1 hr recommended).
4. Wait for BOS/CHoCH confirmation + zone alignment before entry.
5. Use OB and FVG zones for entry/exit planning with risk management.
⸻
💡 Originality Statement
This script introduces a multi-layered institutional logic engine that merges liquidity, mitigation, and imbalance behavior into a unified framework—augmented with time-frame synchronization and signal-cooldown management.
All logic, calculations, and visualization structure were built from scratch for this model.
It is not a mash-up of existing public indicators and offers measurable analytical value through MTF-aware trade validation.
⸻
⚠️ Disclaimer
This tool is intended for educational and analytical purposes only.
It does not provide financial advice or guaranteed trading outcomes.
Always back-test, validate setups, and apply proper risk management.

Brahmastra with SMC by PoojaSummary
This indicator provides a structured trend-and-momentum workflow that issues Partial and Confirmed trade signals using a combination of trend filters, momentum confirmation, and structure breaks.
It helps traders identify higher-probability trade locations through multi-timeframe confirmation and automatic alert payloads — while keeping the underlying signal logic private (invite-only).
Core Components (high level overview — no source code revealed)
• Trend Filters: EMA (configurable length), VWAP, and Supertrend are used to define overall trend direction and to gate signals.
• Momentum: RSI (configurable length and upper/lower thresholds) helps confirm momentum and optional divergence blocking.
• Market Structure: BOS / CHoCH (Break of Structure / Change of Character) logic with MTF pivots to detect structure-based opportunities.
• Signal Types: Partial signals appear early as potential setups; Confirmed signals meet stricter multi-factor conditions (EMA/VWAP/Supertrend + RSI + optional MTF).
• Repaint Safety: Non-repaint mode available (triggers only after candle close).
• Alerts: Built-in alert messages with optional JSON webhook format.
• Customization: Flexible inputs for sessions, pivots, labels, colors, lookbacks, and MTF parameters to adapt across multiple timeframes.
How to Interpret Signals
• Treat Partial signals as setups to monitor — not instant entries. Wait for confirmation or confluence from price behavior.
• Treat Confirmed signals as higher-probability opportunities that satisfy trend and momentum alignment.
• Enable MTF confirmation selectively on smaller timeframes (e.g., 5m using 15m/1H confirmation).
• Use Non-repaint mode (trigger only after candle close) for safe alert generation.
Limitations & Risk Notice
This indicator does not guarantee profits or accuracy. It is a technical and educational tool meant to assist analysis.
All trading decisions, entries, and exits are the sole responsibility of the user. Always perform backtesting and paper trading before live use.
This is not financial advice.
Version Note & Support
This is a closed invite-only script. The indicator includes configuration options for labels, alerts, and MTF pivots.
For approved users seeking modifications or usage details, please contact the author (see Author’s Instructions section).

SMC Structures and Multi-Timeframe FVG PYSMC Structures and Multi-Timeframe FVG Indicator
Tip: For optimal performance, adjust the number of FVGs displayed per timeframe in the settings. On high-performance devices, up to 8 FVGs per timeframe can be used without issues. If you experience slowdowns, reduce to 3 or 4 FVGs per timeframe. If the chart flashes, disable indicators one by one to identify conflicts, or try using the TradingView Mobile or Windows App for a smoother experience.
Overview
This Pine Script indicator enhances market analysis by integrating Smart Money Concepts (SMC) with Fair Value Gaps (FVG) across multiple timeframes. It identifies trend continuations (Break of Structure, BOS) and trend reversals (Change of Character, CHoCH) while highlighting liquidity zones through FVG detection. The indicator includes eight customizable Moving Average (MA) curve templates, disabled by default, to complement SMC and FVG analysis. Its originality lies in combining multi-timeframe FVG detection with SMC structure analysis, providing traders with a cohesive tool to visualize price action patterns and liquidity zones efficiently.
Features and Functionality
1. Fair Value Gaps (FVG)
The indicator detects and displays bullish, bearish, and mitigated FVGs, representing liquidity zones where price inefficiencies occur. These gaps are dynamically updated based on price action:
Bullish FVG: Displayed in green when unmitigated, indicating potential upward liquidity zones.
Bearish FVG: Displayed in red when unmitigated, signaling potential downward liquidity zones.
Mitigated FVG: Shown in gray once the gap is partially filled by price action.
Fully Mitigated FVG: Automatically removed from the chart when the gap is fully filled, reducing visual clutter.
Users can customize the number of historical FVGs displayed via the settings, allowing focus on recent liquidity zones for targeted analysis.
2. SMC Structures
The indicator identifies key SMC price action patterns:
Break of Structure (BOS): Marked with gray lines, indicating trend continuation when price breaks a significant high or low.
Change of Character (CHoCH): Highlighted with yellow lines, signaling potential trend reversals when price fails to maintain the current structure.
High/Low Values: Blue lines denote the highest high and lowest low of the current structure, providing reference points for market context.
3. Multi-Timeframe FVG Analysis
A standout feature is the ability to analyze FVGs across multiple timeframes simultaneously. This allows traders to align higher-timeframe liquidity zones with lower-timeframe entries, improving trade precision. The indicator fetches FVG data from user-selected timeframes, displaying them cohesively on the chart.
4. Moving Average (MA) Templates
The indicator includes eight customizable MA curve templates in the Settings > Template section, disabled by default. These templates allow users to overlay MAs (e.g., SMA, EMA, WMA) to complement SMC and FVG analysis. Each template is pre-configured with different periods and types, enabling quick adaptation to various trading strategies, such as trend confirmation or dynamic support/resistance.
How It Works
The script processes price action to detect FVGs by analyzing three-candle patterns where a gap forms between the high/low of the first and third candles. Multi-timeframe data is retrieved using Pine Script’s request.security() function, ensuring accurate FVG plotting across user-defined timeframes. BOS and CHoCH are identified by tracking swing highs and lows, with logic to differentiate trend continuation from reversals. The MA templates are computed using standard Pine Script TA functions, with user inputs controlling visibility and parameters.
How to Use
Add to Chart: Apply the indicator to any TradingView chart.
Configure Settings:
FVG Settings: Adjust the number of historical FVGs to display (default: 10). Enable/disable specific FVG types (bullish, bearish, mitigated).
Timeframe Selection: Choose up to three timeframes for FVG analysis (e.g., 1H, 4H, 1D) to align with your trading strategy.
Structure Settings: Toggle BOS (gray lines) and CHoCH (yellow lines) visibility. Adjust sensitivity for structure detection if needed.
MA Templates: Enable MA curves via the Template section. Select from eight pre-configured MA types and periods to suit your analysis.
Interpret Signals:
Use green/red FVGs for potential entry points targeting liquidity zones.
Monitor gray lines (BOS) for trend continuation and yellow lines (CHoCH) for reversal signals.
Align multi-timeframe FVGs with BOS/CHoCH for high-probability setups.
Optionally, use MA curves for trend confirmation or dynamic levels.
Clean Chart Usage: The indicator is designed to work standalone. Ensure no conflicting scripts are applied unless explicitly needed for your strategy.
Why This Indicator Is Unique
Unlike standalone FVG or SMC indicators, this script combines both concepts with multi-timeframe analysis, offering a comprehensive view of market structure and liquidity. The addition of customizable MA templates enhances flexibility, while the dynamic removal of mitigated FVGs keeps the chart clean. This mashup is purposeful, as it integrates complementary tools to streamline decision-making for traders using SMC strategies.
Credits
This indicator builds on foundational SMC and FVG concepts from the TradingView community. Some open-source code was reused, and do performance enhancement as you guys can read the code. This type of indicators has inspiration was drawn from public domain SMC methodologies. All code is partly original with manual work on performance optimization in Pine Script.
Notes
Ensure your chart is clean (no unnecessary drawings or indicators) to maximize clarity.
The indicator is open-source, and traders are encouraged to review the code for deeper understanding.
For optimal use, test the indicator on a demo account to familiarize yourself with its signals.

AriVestHub_SMCIntroduction to the AriVestHub_SMC Indicator
The AriVestHub_SMC indicator is designed and coded based on Smart Money Concepts (SMC). This tool has unique features that you won’t find in any other indicator built around SMC.
I’ve been active in the crypto market since 2019, and besides using the SMC strategy, I also apply several custom strategies in my trading. Personalized versions of these strategies will gradually be shared with you as well.
The main reason for developing this indicator was the gap in existing tools. Many times, setups like Valid Pullback or Inside Bar Candles appear on the chart but are not easily recognizable at first glance, and therefore they get ignored. This often leads to mistakes in Market Structure Mapping right from the beginning, which then causes errors in further analysis and predictions.
Since the SMC strategy is entirely built on market structure, any mistake in identifying its key components basically destroys the reliability of the analysis.
Unlike similar indicators that mostly just draw nice lines and zones on the chart for promotional purposes, AriVestHub_SMC aims to show the reality of the market, not beautify it. Price behavior is the result of trader psychology and the clash of different views—it doesn’t have to look neat and pretty all the time.
This indicator shows exactly what has happened in the market and the possible scenarios ahead. Once you use this tool and study this guide, you’ll clearly feel the difference compared to other common indicators. My main goal in creating AriVestHub_SMC was to give real help to traders—not just to sell or commercialize it.
The AriVestHub_SMC indicator is basically a Market Structure Mapping Engine (SMC Structure Mapping Engine), whose main task is to detect and accurately map market structure movements.
The market is full of exceptional conditions, and analyzing them without indicators and only by visual inspection is almost impossible. This often leads to errors, especially in strategies that are based on market structure.
One of the most important and valuable features of this indicator compared to similar ones is that, after extensively studying and manually analyzing various charts with indicators, I have coded almost all common scenarios as well as exceptional cases that occur under different market conditions.
________________________________________
Its key features include:
• BOS / CHoCH – Detecting
• breakouts and changes in market character
• IDM / Pullback – Confirming pivots and valid moves
• OF / OB – Marking key supply and demand zones
• SMT (Smart Money Trap) – Spotting invalid zones and smart money traps
• Liquidity Sweeps / Equal High-Low – Liquidity hunts and reversal setups
• Transfer Option – Automatically correcting structure in Single Leg scenarios
________________________________________
Basic Concepts in the AriVestHub_SMC Strategy
1. Inside Bar
An Inside Bar is a candle (or group of candles) whose price range falls between the High and Low of the previous candle.
In Smart Money and market structure analysis, these candles are usually ignored, and only the main candle is considered.
Simply put, an Inside Bar signals market pause and energy buildup—a place where both buyers and sellers are waiting for price to decide its next direction.
In the picture, you can see candles highlighted in a different color that fall within the main candle range. They should not be treated as independent candles, and all of them together should be considered as one.
________________________________________
2. Pullback
A pullback happens when price makes a temporary return after a main move. Even a single candle can cause it.
In Smart Money, a valid pullback is defined as:
• In an uptrend: if the Low of a candle breaks the Low of the previous candle which is not an Inside Bar, a valid pullback occurs.
• In a downtrend: if the High of a candle breaks the High of the previous candle which is not an Inside Bar, a valid pullback occurs.
Valid pullbacks are the points where the market gathers the energy needed to continue its move.
In the image below, both valid and invalid pullbacks are shown.
________________________________________
3. IDM – Inducement
Inducement is one of the most important concepts in AriVestHub_SMC. Without IDM, no structure in Smart Money can form.
Every valid pullback can be considered an IDM.
There are two types: Major IDM and Minor IDM.
Correctly identifying IDM is critical, because the entire market structure is mapped based on it.
After each BOS or CHoCH, a new HH or LL pivot is only confirmed if the price returns and touches the IDM.
• In an uptrend after BOS: the lowest price of the first valid pullback is the Major IDM, and the last pullback before reaching the Major IDM is the Minor IDM.
• In an uptrend after CHoCH: the highest price of the first valid pullback is the Major IDM, and the last pullback before reaching the Major IDM is the Minor IDM.
The same rules apply in reverse for downtrends.
In this strategy, Major IDM always takes priority.
The image shows different types of IDM, and the same applies for downtrends.
________________________________________
4. BOS – Break of Structure
A Break of Structure happens when price breaks its previous High or Low in the direction of the trend:
• In an uptrend: if the previous HH is broken, BOS occurs.
• In a downtrend: if the previous LL is broken, BOS occurs.
BOS confirms continuation of the current market trend.
________________________________________
5. CHoCH – Change of Character
Change of Character occurs when price moves against the previous trend:
• In an uptrend: if the previous LL is broken, CHoCH occurs.
• In a downtrend: if the previous HH is broken, CHoCH occurs.
CHoCH is usually a signal of a trend reversal or a deep market correction.
The image shows the overall market structure with BOS and CHoCH.
________________________________________
6. Order Flow
Order Flow zones are formed from valid pullbacks and are usually points where price reacts strongly.
They are defined as:
• In an uptrend: Last Selling Momentum Before pushing upside
• In a downtrend: Last Buying Momentum Before pushing dowside
Three main types of Order Flow used in this strategy:
• OF: Decisional (Dec) – The first valid OF after IDM, where the market makes its key decision.
• OF: Extreme (Ext) – The last valid OF after IDM, acting as the final defense of buyers or sellers.
• SMT – Smart Money Trap – All order zones before IDM, and those between Dec and Ext. These usually cause short-term, deceptive reactions and are not valid for trading.
In addition:
• Unmitigated Order Flow – A zone not yet touched, still a liquidity source.
• Mitigated Order Flow – A zone that has been touched, with reduced validity.
• Redefine Order Flow – Identifying internal OFs within a main unmitigated OF for more precise entries.
The image shows the different types of OF.
________________________________________
7. H/L Liquidity Sweep
A Liquidity Sweep happens when price breaks a previous High or Low with a wick, but the candle body fails to close beyond it.
• If the High is broken with a wick but the candle closes below it, a Liquidity Sweep occurs.
• If the Low is broken with a wick but the candle closes above it, a Liquidity Sweep occurs.
These setups are often signs of trapping traders and starting a move in the opposite direction. In fact, Liquidity Sweep points are among the best trading setups.
________________________________________
🔑 Final Note
All these concepts are like puzzle pieces: Inside Bar, Valid Pullback, IDM, BOS, CHoCH, Order Flow, and Liquidity Sweep.
When combined, they create a clear and accurate picture of the market’s real behavior.
________________________________________
Indicator Settings
1. Analyze From … To …
• Set the analysis time range.
• Another use: In ping-pong structures, you can add another copy of the indicator to the chart, set the starting point at the recent HH or LL, and map the internal structure for counter-trend trading.
________________________________________
2. Main
• Confirm CHoCH with wicks → If enabled, only the wick (not the body) is considered for BOS and CHoCH confirmation. Useful for spotting subtle liquidity-based breaks.
• Major / Minor IDM → Choose IDM type.
• Consider Inside Bar → Best kept enabled, so candles inside the previous candle are ignored.
________________________________________
3. Fib Ret
• Min pullback retracement % → Set the minimum retracement level.
• Helps identify valid pullbacks and gives more confidence in trend continuation.
• Meaning: if BOS happens, price must at least retrace by the minimum percentage before expecting the trend to continue.
________________________________________
4. BOS/CHoCH
• Display BOS and CHoCH on the chart with customizable color and style.
________________________________________
5. IDM
• Mark previous IDM : Show past IDMs.
• Mark live IDM : Show current active IDM.
• Customize IDM display options.
________________________________________
6. Pivots
• Display HH and LL pivots.
________________________________________
7. Transferring H/L IDM BOS/CHoCH
• Transfer in case of lack idmB or idmS → When the move is Single Leg and no valid IDM exists in the recent move, HH, LL, and IDM must be shifted and corrected. This adjusts the market structure.
• In case of transferring, remove all previous transferred Market Structure → If enabled, every time HH/LL and IDM need to be shifted, the transfer happens and the market structure is re-analyzed from scratch.
• Important: Often after one transfer, another Single Leg appears. This option keeps adjusting structure automatically, while doing it manually would be slow and error-prone.
________________________________________
8. Order Flow
• Display Decisional, Extreme, and Supply/Demand OFs.
________________________________________
9. H/L Sweeps
• Detect Liquidity Sweeps at Highs and Lows.
• These are very strong reversal setups.
________________________________________
10. Equal High/Low
• Show equal Highs and Lows where liquidity often accumulates.
________________________________________
11. Moving Average
• Add a moving average as a trend filter.
• Option to choose type (SMA/EMA) and length (e.g., 50 or 200).
• Usually:
o MA50 → For mid-term trends, quick confirmation.
o MA200 → For long-term trends, stronger confirmation.
________________________________________
12. Internal Structure (ZigZag)
• Show internal market structure as ZigZag.
________________________________________
13. Inside Bar Candles
• Display Inside Bars in color or with a box.

Market Structure ICT Screener [TradingFinder] BoS ChoCh🔵 Introduction
Market Structure is the foundation of every Smart Money and ICT based trading model. It describes how price moves through a sequence of highs and lows, forming clear phases of expansion, retracement and reversal. Understanding this structure allows traders to read institutional order flow and align their positions with the true direction of liquidity.
Two of the most critical components in Market Structure are the Break of Structure (BOS) and Change of Character (CHOCH). A BOS represents trend continuation, confirming strength within the current direction. In contrast, CHOCH also known as a Market Structure Shift (MSS) signals the first sign of a trend reversal or liquidity shift where order flow begins to change from bullish to bearish or vice versa.
Because the market is fractal, structure can exist at multiple levels known as Major (External) and Minor (Internal). Major structure defines the overall trend on higher timeframes while minor or internal structure reveals short term swings and early reversals within that larger move.
🔵 How to Use
Understanding Market Structure starts with identifying how price interacts with previous swing highs and swing lows. Every trend in the market, whether bullish or bearish, is built from a sequence of impulsive and corrective moves. Impulsive legs show strong displacement in the direction of liquidity flow, while corrective legs represent temporary pullbacks as the market rebalances before the next expansion. Recognizing these sequences is essential for reading the story of price and anticipating what may happen next.
A Break of Structure (BOS) occurs when price decisively moves beyond a previous structural point by breaking above the last high in an uptrend or falling below the last low in a downtrend. This event confirms that the current trend remains intact and that liquidity has been successfully taken from one side of the market. A BOS acts as confirmation of continuation and reflects strength within the existing directional bias.
A Change of Character (CHOCH) appears when price violates structure in the opposite direction of the prevailing trend. This is the first signal that market sentiment and order flow may be shifting. For example, during a downtrend if price breaks above a previous high, it indicates that sellers are losing control and a potential bullish reversal may be developing. In an uptrend, when price drops below a recent low, it suggests a possible bearish transition.
Because the market is fractal, structure exists across multiple layers. Major structure reflects the dominant movement visible on higher timeframes and defines the broader directional bias. Minor or internal structure represents smaller swings within that move and helps identify early transitions before they appear on the higher timeframe. When internal and external structures align, they offer a high probability signal for trend continuation or reversal.
By observing BOS and CHOCH across both internal and external structures, traders can clearly visualize when the market is expanding, contracting or preparing to shift direction. This structured understanding of price movement forms the foundation for precise trend analysis and high quality decision making in any Smart Money or ICT based trading approach.
🔵 Settings
🟣 Display Settings
Table on Chart : Allows users to choose the position of the signal dashboard either directly on the chart or below it, depending on their layout preference.
Number of Symbols : Enables users to control how many symbols are displayed in the screener table, from 10 to 20, adjustable in increments of 2 symbols for flexible screening depth.
Table Mode : This setting offers two layout styles for the signal table :
Basic : Mode displays symbols in a single column, using more vertical space.
Extended : Mode arranges symbols in pairs side-by-side, optimizing screen space with a more compact view.
Table Size : Lets you adjust the table’s visual size with options such as: auto, tiny, small, normal, large, huge.
Table Position : Sets the screen location of the table. Choose from 9 possible positions, combining vertical (top, middle, bottom) and horizontal (left, center, right) alignments.
🟣 Symbol Settings
Each of the 20 symbol slots comes with a full set of customizable parameters :
Symbol : Define or select the asset (e.g., XAUUSD, BTCUSD, EURUSD, etc.).
Timeframe : Set your desired timeframe for each symbol (e.g., 15, 60, 240, 1D).
Pivot Period : Set the length used to detect swing highs and lows. Shorter values increase sensitivity, longer ones focus on major structures.
🔵 Conclusion
Mastering Market Structure and understanding the relationship between BOS and CHOCH allows traders to see the market with greater clarity and confidence. These two elements reveal how liquidity moves through different phases of expansion and retracement and how institutional order flow shifts between accumulation and distribution.
By analyzing both internal and external structures, traders can align short term and long term perspectives and anticipate where price is most likely to react. The ability to read these structural shifts helps identify continuation points, reversals and areas where liquidity is engineered or collected.
Incorporating Market Structure into a consistent trading process transforms the way a trader views the chart. Instead of reacting to random movements, each swing, break and shift becomes part of a logical framework that reflects the true behavior of the market. Understanding BOS and CHOCH is not just a concept but a complete language of price that guides every professional decision in Smart Money and ICT based trading.

Trend Fib Zone Bounce (TFZB) [KedArc Quant]Description:
Trend Fib Zone Bounce (TFZB) trades with the latest confirmed Supply/Demand zone using a single, configurable Fib pullback (0.3/0.5/0.6). Trade only in the direction of the most recent zone and use a single, configurable fib level for pullback entries.
• Detects market structure via confirmed swing highs/lows using a rolling window.
• Draws Supply/Demand zones (bearish/bullish rectangles) from the latest MSS (CHOCH or BOS) event.
• Computes intra zone Fib guide rails and keeps them extended in real time.
• Triggers BUY only inside bullish zones and SELL only inside bearish zones when price touches the selected fib and closes back beyond it (bounce confirmation).
• Optional labels print BULL/BEAR + fib next to the triangle markers.
What it does
Finds structure using confirmed swing highs/lows (you choose the confirmation length).
Builds the latest zone (bullish = demand, bearish = supply) after a CHOCH/BOS event.
Draws intra-zone “guide rails” (Fib lines) and extends them live.
Signals only with the trend of that zone:
BUY inside a bullish zone when price tags the selected Fib and closes back above it.
SELL inside a bearish zone when price tags the selected Fib and closes back below it.
Optional labels print BULL/BEAR + Fib next to triangles for quick context
Why this is different
Most “zone + fib + signal” tools bolt together several indicators, or fire counter-trend signals because they don’t fully respect structure. TFZB is intentionally minimal:
Single bias source: the latest confirmed zone defines direction; nothing else overrides it.
Single entry rule: one Fib bounce (0.3/0.5/0.6 selectable) inside that zone—no counter-trend trades by design.
Clean visuals: you can show only the most recent zone, clamp overlap, and keep just the rails that matter.
Deterministic & transparent: every plot/label comes from the code you see—no external series or hidden smoothing
How it helps traders
Cuts decision noise: you always know the bias and the only entry that matters right now.
Forces discipline: if price isn’t inside the active zone, you don’t trade.
Adapts to volatility: pick 0.3 in strong trends, 0.5 as the default, 0.6 in chop.
Non-repainting zones: swings are confirmed after Structure Length bars, then used to build zones that extend forward (they don’t “teleport” later)
How it works (details)
*Structure confirmation
A swing high/low is only confirmed after Structure Length bars have elapsed; the dot is plotted back on the original bar using offset. Expect a confirmation delay of about Structure Length × timeframe.
*Zone creation
After a CHOCH/BOS (momentum shift / break of prior swing), TFZB draws the new Supply/Demand zone from the swing anchors and sets it active.
*Fib guide rails
Inside the active zone TFZB projects up to five Fib lines (defaults: 0.3 / 0.5 / 0.7) and extends them as time passes.
*Entry logic (with-trend only)
BUY: bar’s low ≤ fib and close > fib inside a bullish zone.
SELL: bar’s high ≥ fib and close < fib inside a bearish zone.
*Optionally restrict to one signal per zone to avoid over-trading.
(Optional) Aggressive confirm-bar entry
When do the swing dots print?
* The code confirms a swing only after `structureLen` bars have elapsed since that candidate high/low.
* On a 5-min chart with `structureLen = 10`, that’s about 50 minutes later.
* When the swing confirms, the script plots the dot back on the original bar (via `offset = -structureLen`). So you *see* the dot on the old bar, but it only appears on the chart once the confirming bar arrives.
> Practical takeaway: expect swing markers to appear roughly `structureLen × timeframe` later. Zones and signals are built from those confirmed swings.
Best timeframe for this Indicator
Use the timeframe that matches your holding period and the noise level of the instrument:
* Intraday :
* 5m or 15m are the sweet spots.
* Suggested `structureLen`:
* 5m: 10–14 (confirmation delay \~50–70 min)
* 15m: 8–10 (confirmation delay \~2–2.5 hours)
* Keep Entry Fib at 0.5 to start; try 0.3 in strong trends, 0.6 in chop.
* Tip: avoid the first 10–15 minutes after the open; let the initial volatility set the early structure.
* Swing/overnight:
* 1h or 4h.
* `structureLen`:
* 1h: 6–10 (6–10 hours confirmation)
* 4h: 5–8 (20–32 hours confirmation)
* 1m scalping: not recommended here—the confirmation lag relative to the noise makes zones less reliable.
Inputs (all groups)
Structure
• Show Swing Points (structureTog)
o Plots small dots on the bar where a swing point is confirmed (offset back by Structure Length).
• Structure Length (structureLen)
o Lookback used to confirm swing highs/lows and determine local structure. Higher = fewer, stronger swings; lower = more reactive.
Zones
• Show Last (zoneDispNum)
o Maximum number of zones kept on the chart when Display All Zones is off.
• Display All Zones (dispAll)
o If on, ignores Show Last and keeps all zones/levels.
• Zone Display (zoneFilter): Bullish Only / Bearish Only / Both
o Filters which zone types are drawn and eligible for signals.
• Clean Up Level Overlap (noOverlap)
o Prevents fib lines from overlapping when a new zone starts near the previous one (clamps line start/end times for readability).
Fib Levels
Each row controls whether a fib is drawn and how it looks:
• Toggle (f1Tog…f5Tog): Show/hide a given fib line.
• Level (f1Lvl…f5Lvl): Numeric ratio in . Defaults active: 0.3, 0.5, 0.7 (0 and 1 off by default).
• Line Style (f1Style…f5Style): Solid / Dashed / Dotted.
• Bull/Bear Colors (f#BullColor, f#BearColor): Per-fib color in bullish vs bearish zones.
Style
• Structure Color: Dot color for confirmed swing points.
• Bullish Zone Color / Bearish Zone Color: Rectangle fills (transparent by default).
Signals
• Entry Fib for Signals (entryFibSel): Choose 0.3, 0.5 (default), or 0.6 as the trigger line.
• Show Buy/Sell Signals (showSignals): Toggles triangle markers on/off.
• One Signal Per Zone (oneSignalPerZone): If on, suppresses additional entries within the same zone after the first trigger.
• Show Signal Text Labels (Bull/Bear + Fib) (showSignalLabels): Adds a small label next to each triangle showing zone bias and the fib used (e.g., BULL 0.5 or BEAR 0.3).
How TFZB decides signals
With trend only:
• BUY
1. Latest active zone is bullish.
2. Current bar’s close is inside the zone (between top and bottom).
3. The bar’s low ≤ selected fib and it closes > selected fib (bounce).
• SELL
1. Latest active zone is bearish.
2. Current bar’s close is inside the zone.
3. The bar’s high ≥ selected fib and it closes < selected fib.
Markers & labels
• BUY: triangle up below the bar; optional label “BULL 0.x” above it.
• SELL: triangle down above the bar; optional label “BEAR 0.x” below it.
Right-Panel Swing Log (Table)
What it is
A compact, auto-updating log of the most recent Swing High/Low events, printed in the top-right of the chart.
It helps you see when a pivot formed, when it was confirmed, and at what price—so you know the earliest bar a zone-based signal could have appeared.
Columns
Type – Swing High or Swing Low.
Date – Calendar date of the swing bar (follows the chart’s timezone).
Swing @ – Time of the original swing bar (where the dot is drawn).
Confirm @ – Time of the bar that confirmed that swing (≈ Structure Length × timeframe after the swing). This is also the earliest moment a new zone/entry can be considered.
Price – The swing price (high for SH, low for SL).
Why it’s useful
Clarity on repaint/confirmation: shows the natural delay between a swing forming and being usable—no guessing.
Planning & journaling: quick reference of today’s pivots and prices for notes/backtesting.
Scanning intraday: glance to see if you already have a confirmed zone (and therefore valid fib-bounce entries), or if you’re still waiting.
Context for signals: if a fib-bounce triangle appears before the time listed in Confirm @, it’s not a valid trade (you were too early).
Settings (Inputs → Logging)
Log swing times / Show table – turn the table on/off.
Rows to keep – how many recent entries to display.
Show labels on swing bar – optional tags on the chart (“Swing High 11:45”, “Confirm SH 14:15”) that match the table.
Recommended defaults
• Structure Length: 10–20 for intraday; 20–40 for swing.
• Entry Fib for Signals: 0.5 to start; try 0.3 in stronger trends and 0.6 in choppier markets.
• One Signal Per Zone: ON (prevents over trading).
• Zone Display: Both.
• Fib Lines: Keep 0.3/0.5/0.7 on; turn on 0 and 1 only if you need anchors.
Alerts
Two alert conditions are available:
• BUY signal – fires when a with trend bullish bounce at the selected fib occurs inside a bullish zone.
• SELL signal – fires when a with trend bearish bounce at the selected fib occurs inside a bearish zone.
Create alerts from the chart’s Alerts panel and select the desired condition. Use Once Per Bar Close to avoid intrabar flicker.
Notes & tips
• Swing dots are confirmed only after Structure Length bars, so they plot back in time; zones built from these confirmed swings do not repaint (though they extend as new bars form).
• If you don’t see a BUY where you expect one, check: (1) Is the active zone bullish? (2) Did the candle’s low actually pierce the selected fib and close above it? (3) Is One Signal Per Zone suppressing a second entry?
• You can hide visual clutter by reducing Show Last to 1–3 while keeping Display All Zones off.
Glossary
• CHOCH (Change of Character): A shift where price breaks beyond the last opposite swing while local momentum flips.
• BOS (Break of Structure): A cleaner break beyond the prior swing level in the current momentum direction.
• MSS: Either CHOCH or BOS – any event that spawns a new zone.
Extension ideas (optional)
• Add fib extensions (1.272 / 1.618) for target lines.
• Zone quality score using ATR normalization to filter weak impulses.
• HTF filter to only accept zones aligned with a higher timeframe trend.
⚠️ Disclaimer This script is provided for educational purposes only.
Past performance does not guarantee future results.
Trading involves risk, and users should exercise caution and use proper risk management when applying this strategy.

VWAP + Range Breakout (Pre-Signal for Manual Entry)WHAT IT DOES
This tool highlights potential breakout opportunities when price sweeps the previous day’s high or low and aligns with VWAP and short-term range levels. It provides both pre-signals (early warnings) and confirmed signals (breakout closed) so traders can prepare before momentum accelerates.
Works on all timeframes and across markets (indices, forex, crypto). Especially useful during active London and New York sessions.
---
KEY FEATURES
Daily sweep logic: previous day high/low as liquidity reference
VWAP with cumulative calculation
Adjustable range breakout levels
Optional SMA trend filter
Session filter (London / NY trading hours)
Pre-Signal markers (early alert before breakout)
Confirmed LONG/SHORT signals after breakout close
Alerts for Pre-Long, Pre-Short, and Confirmed entries
---
HOW TO USE
1. Wait for price to sweep the previous day high/low.
2. Look for alignment with VWAP and the defined range breakout levels.
3. Use trend/session filters for higher accuracy.
4. Combine with your own risk management rules.
---
SETTINGS TIPS
Adjust range lookback for different timeframes (shorter for fast intraday, longer for higher timeframes).
Enable/disable session filters depending on your market.
Use SMA trend filter to stay aligned with higher-timeframe bias.
---
WHO IT’S FOR
Scalpers, intraday, and swing traders who want early signals when liquidity is taken and price is preparing for a breakout.
---
NOTES
For educational purposes only. No financial advice.
This script is open-source; redistribution follows TradingView rules.

Smart Money LITE — Daily Sweep → HQ Signals (VWAP • FVG • CHoCH) 🔗 PRO VERSION (VWAP + FVG + CHoCH — full confirmations, all timeframes):
chartedgepro.gumroad.com/l/rmnbhw
Daily liquidity sweep → confluence signals with VWAP, FVG & CHoCH. Works on all timeframes & markets (Indices, Forex, Crypto).
WHAT IT DOES
Smart Money LITE+ highlights high-quality LONG/SHORT signals only after daily liquidity is swept (previous day high/low) with confluence from VWAP, FVG and structure (BOS/CHoCH).
Works on all timeframes and across markets: indices, forex, crypto.
KEY FEATURES (Lite)
• Daily sweep logic (PDH/PDL) + previous day zones
• VWAP + deviation bands (optional) and proximity filter
• 3-bar FVG boxes (visual) with adjustable extension
• ATR/volatility filter, optional HTF trend filter
• Anti-spam cooldown, clean LONG/SHORT labels
• Alerts: HQ LONG / HQ SHORT
HOW TO USE
1. Wait for price to sweep PDH/PDL → indicator opens “signal window”.
2. Look for confluence: VWAP touch/proximity + CHoCH or BOS in direction.
3. Enter with proper risk management (stop beyond swing/zone, partials).
SETTINGS TIPS
• Enable “Require VWAP Confluence?” for strictest setups.
• Use “HTF Trend Filter?” to align with higher-timeframe EMA trend.
• Adjust “After sweep (bars)” to define signal validity window.
• FVGs are visual in Lite — advanced filtering and confirmation are in Pro.
WHO IT'S FOR
Scalpers, intraday, and swing traders looking for objective, visual signals based on liquidity sweeps and VWAP/FVG confluence.
PRO VERSION (full confirmations)
Adds advanced FVG/iFVG logic, more confluence filters, dynamic risk tools and extended alert packages — optimized for all timeframes.
👉 chartedgepro.gumroad.com/l/rmnbhw
NOTES
• For educational purposes only. No financial advice.
• “Lite” is open-source; redistribution of code follows TradingView rules.

SMC Structure SuiteSMC Structure Suite — BOS, CHOCH & Order Blocks
This indicator provides automated Smart Money Concepts (SMC) tools to help traders analyze market structure objectively. It is designed for traders who want to quickly identify shifts in price behavior without manually marking charts.
Core Features
Market Structure Recognition
Automatically detects Higher Highs (HH), Lower Lows (LL), Higher Lows (HL), and Lower Highs (LH). Detection uses a pullback validation mechanism to confirm swing structure.
BOS & CHOCH Detection
Identifies Break of Structure (BOS) for potential continuation and Change of Character (CHOCH) for possible reversals.
Order Block Highlighting
Marks bullish and bearish order blocks when confirmed by price action. Options allow choosing mitigation style (wick touch or body close). Blocks are hidden when invalidated.
Multi-Timeframe Analysis
Works on any timeframe. Historical analysis allows reviewing past structure.
Customizable Visuals
Colors, label positions, and background style can be adjusted for a clear chart.
Alert System
Alerts are provided for trend changes to monitor potential shifts in market direction in real time.
Disclaimer
This indicator is a tool to assist with chart analysis. It does not guarantee results and is not financial advice. Use appropriate risk management.

Signalgo CHoCHSignalgo CHoCH: Informative Technical Overview
Signalgo CHoCH is a multi-factor indicator designed for TradingView to detect “Change of Character” (CHoCH) shifts in market structure, signaling significant trend reversals and managing trades with risk control. This documentation details how it operates, its customizable parameters, signal methodology, what makes it different from traditional tools, and typical strategy applications.
How Signalgo CHoCH Works
1. Market Structure Detection
Swing High & Low Identification: The indicator uses an adaptive swing length to isolate important pivot highs and lows in price action. These pivots signal points where the market reversed direction or paused, forming the “swing structure” core to this strategy.
Body Strength Validation: Not every pivot break is meaningful. Signalgo CHoCH assesses price bar “body strength”—quantifying if the current candle’s body is disproportionately large compared to a recent average—to filter out weak or indecisive moves, retaining only those breaks likely to indicate genuine momentum.
2. Change of Character (CHoCH) Signal Logic
Bullish CHoCH: Triggered when price closes above the last significant swing low (the most recent support) with a strong candle body, indicating a transition from bearish to bullish market structure.
Bearish CHoCH: Triggered when price closes below the last significant swing high (key resistance) with a strong bearish candle, denoting a shift from bullish to bearish structure.
One-Time Event Recognition: Each break is tracked so that signals are issued only once per directional change, reducing repeated or redundant entries.
3. Higher Timeframe Confirmation
Multi-Timeframe Consistency: The indicator requires the CHoCH signal (on the current trading timeframe) to be confirmed by the market structure status of a selected higher timeframe. This adds an extra layer of validation, ensuring the signal aligns with broader trends.
Inputs
SwingLen: The number of bars used to define swing pivots.
bodyStrength & bodyLookback: Control sensitivity for body size validation, filtering which candle breaks are considered strong enough for signaling.
htfTf: Selects the higher timeframe for multi-timeframe checking.
show_tpsl: Toggle to show/hide automated Take Profit (TP) and Stop Loss (SL) levels on the chart.
ATR, TP/SL/RR/Trailing Settings: Determines how risk and reward are managed, using ATR for stop placement and multi-level profit targets with optional trailing stop activation after TP1.
Entry & Exit Strategy
Entry Logic
Long Entry: When a bullish CHoCH is detected, optionally confirmed by the higher timeframe, it marks a buy opportunity at the close of the breakout candle.
Short Entry: When a bearish CHoCH forms, also with optional higher timeframe confirmation, it identifies a sell entry at the close of the confirmation candle.
Exit & Trade Management
Stop Loss (SL): Automatically placed at a set ATR distance from entry, dynamically adapting to volatility.
Take Profits (TP1, TP2, TP3): Multiple reward targets are calculated and marked for systematic scaling out or profit-taking, based on a defined risk multiple.
Trailing Stop: Once the first profit target is hit, SL moves to breakeven, and a trailing stop engages, incrementally securing further gains if the trend continues.
State Tracking: All TP, SL, and trailing events are labeled on the chart for easy post-trade analysis.
Body Strength and Trend Filtering: Breakouts are only considered if the candle’s body confirms significant momentum, not just a fleeting spike, improving signal quality.
Event-Driven, Not Rolling: Each bullish or bearish “character change” is signaled only at the true point of structural shift, with strict per-event marking, not continuous signal generation as with typical MA cross strategies.
Integrated Multi-Timeframe Logic: higher timeframe validation minimizes false positives from short-term volatility noise, a capability not found in most indicator-based tools.
Automated, Dynamic Trade Management: This indicator overlays a complete trade management suite (TPs, SL, trailing) that moves with market conditions, allowing for risk handling directly from each signal.
Trading Strategy Application
Trend Reversal & Continuation: Suitable for identifying both sudden reversals and structural continuations, adaptable for intraday, swing, or positional trading styles.
Noise Filtering: Multiple checks (body strength, momentum, multi-timeframe) focus signals on genuine trend changes, filtering out most “whipsaws” seen in pure MA systems.
Visual Feedback: All transitions, TPs, SLs, and trailing events are visually annotated, enhancing the educational and review process.
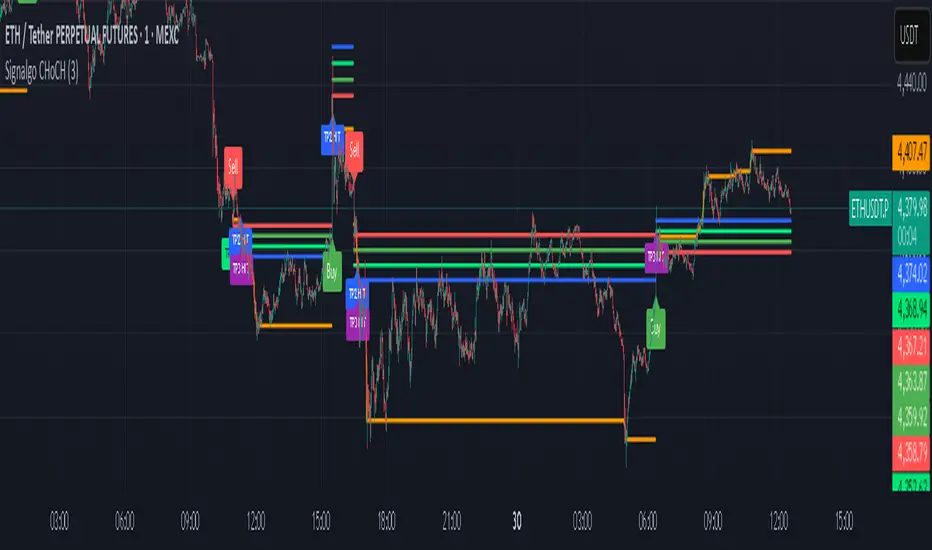
Vietnamese: Swing Low Detection with SMA Bands & BackgroundThis script detects **swing lows** using a dynamic SMA-based logic and visually highlights them on the chart.
Features
Customizable Moving Averages: Supports multiple MA types (SMA, EMA, WMA, RMA, HMA, DEMA, TEMA, VWMA).
Swing Low Visualization: Identifies swing lows when price closes below the SMA of lows and exits once price trades above the SMA of highs.
Smart Rectangles: Marks detected swing lows with labeled boxes for clear visual reference.
Background Highlights**: Dynamically shades the chart background when price breaks below recent swing lows, helping traders spot potential breakdown zones.
Configurable Parameters: Period length, rectangle length, and MA source can all be tuned.
Use Cases
Spot breakdown/bearish continuation signals when price closes under recent lows.
Combine with higher timeframe trend analysis for confluence.
Notes
* This tool is designed for **visual analysis** and is not a standalone buy/sell signal.
* Works best when combined with broader trend analysis, support/resistance levels, and volume.

BOS & CHoCH (v6, UA)The logic of the trading strategy
This is a well-structured and concise summary of a trading strategy based on market structure analysis. Here is the English translation.
Swings
ta.pivothigh/low on a selected structure timeframe (TF). When a swing is confirmed, we fix the level and the bar_index of the current chart as an anchor for a horizontal line.
BOS (Break of Structure)
A breakout of the last Swing High (SH) or Swing Low (SL) in the direction of the current trend.
CHoCH (Change of Character)
A breakout against the trend, signaling a potential trend reversal.
Breakout
By close or by high/low (you can switch the breakout confirmation mode to closing price).

Angle Market Structure [BigBeluga]🔵 OVERVIEW
Angle Market Structure is a smart pivot-based tool that dynamically adapts to price action by accelerating breakout and breakdown detection. It draws market structure levels based on pivot highs/lows and gradually adjusts those levels closer to price using an angle threshold. Upon breakout, the indicator projects deviation zones with labeled levels (+1, +2, +3 or −1, −2, −3) to track price extension beyond structure.
🔵 CONCEPTS
Adaptive Market Structure: Uses pivots to define structure levels, which dynamically angle closer to price over time to capture breakouts sooner.
Breakout Acceleration: Pivot high levels decrease and pivot low levels increase each bar using a user-defined angle (based on ATR), improving reactivity.
Deviation Zones: Once a breakout or breakdown occurs, 3 deviation levels are projected to show how far price extends beyond the breakout point.
Count Labels: Each successful structure break is numbered sequentially, giving traders insight into momentum and trend persistence.
Visual Clarity: The script uses colored pivot points, trend lines, and extension labels for easy structural interpretation.
🔵 FEATURES
Calculates pivot highs and lows using a customizable length.
Applies an angle modifier (ATR-based) to gradually pull levels closer to price.
Plots breakout and breakdown lines in distinct colors with automatic extension.
Shows deviation zones (+1, +2, +3 or −1, −2, −3) after breakout with customizable size.
Color-coded labels for trend break count (bullish or bearish).
Dynamic label sizing and theme-aware colors.
Smart label positioning to avoid chart clutter.
Built-in limit for deviation zones to maintain clarity and performance.
🔵 HOW TO USE
Use pivot-based market structure to identify breakout and breakdown zones.
Watch for crossover (up) or crossunder (down) events as trend continuation or reversal signals.
Observe +1/+2/+3 or -1/-2/-3 levels for overextension opportunities or trailing stop ideas.
Use breakout count as a proxy for trend strength—multiple counts suggest momentum.
Combine with volume or order flow tools for higher confidence entries at breakout points.
Adjust the angle setting to fine-tune sensitivity based on market volatility.
🔵 CONCLUSION
Angle Market Structure enhances traditional pivot-based analysis by introducing breakout acceleration and structured deviation tracking. It’s a powerful tool for traders seeking a cleaner, faster read on market structure and momentum strength—especially during impulsive price moves or structural transitions.
