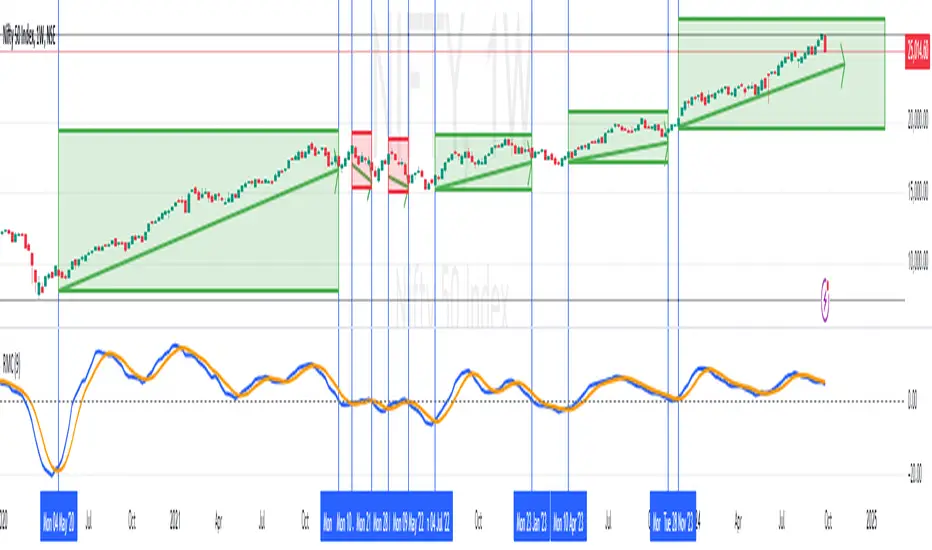
DeNoised Momentum [OmegaTools]The DeNoised Momentum by OmegaTools is a versatile tool designed to help traders evaluate momentum, acceleration, and noise-reduction levels in price movements. Using advanced mathematical smoothing techniques, this script provides a "de-noised" view of momentum by applying filters to reduce market noise. This helps traders gain insights into the strength and direction of price trends without the distractions of market volatility. Key components include a DeNoised Moving Average (MA), a Momentum line, and Acceleration bars to identify trend shifts more clearly.
Features:
- Momentum Line: Measures the percentage change of the de-noised source price over a specified look-back period, providing insights into trend direction.
- Acceleration (Ret) Bars: Visualizes the rate of change of the source price, helping traders identify momentum shifts.
- Normal and DeNoised Moving Averages: Two moving averages, one based on close price (Normal MA) and the other on de-noised data (DeNoised MA), enable a comparison of smoothed trends versus typical price movements.
- DeNoised Price Data Plot: Displays the current de-noised price, color-coded to indicate the relationship between the Normal and DeNoised MAs, which highlights bullish or bearish conditions.
Script Inputs:
- Length (lnt): Sets the period for calculations (default: 21). It influences the sensitivity of the momentum and moving averages. Higher values will smooth the indicator further, while lower values increase sensitivity to price changes.
The Length does not change the formula of the DeNoised Price Data, it only affects the indicators calculated on it.
Indicator Components:
1. Momentum (Blue/Red Line):
- Calculated using the log of the percentage change over the specified period.
- Blue color indicates positive momentum; red indicates negative momentum.
2. Acceleration (Gray Columns):
- Measures the short-term rate of change in momentum, shown as semi-transparent gray columns.
3. Moving Averages:
- Normal MA (Purple): A standard simple moving average (SMA) based on the close price over the selected period.
- DeNoised MA (Gray): An SMA of the de-noised source, reducing the effect of market noise.
4. DeNoised Price Data:
- Represented as colored circles, with blue indicating that the Normal MA is above the DeNoised MA (bullish) and red indicating the opposite (bearish).
Usage Guide:
1. Trend Identification:
- Use the Momentum line to assess overall trend direction. Positive values indicate upward momentum, while negative values signal downward momentum.
- Compare the Normal and DeNoised MAs: when the Normal MA is above the DeNoised MA, it indicates a bullish trend, and vice versa for bearish trends.
2. Entry and Exit Signals:
- A change in the Momentum line's color from blue to red (or vice versa) may indicate potential entry or exit points.
- Observe the DeNoised Price Data circles for early signs of a trend reversal based on the interaction between the Normal and DeNoised MAs.
3. Volatility and Noise Reduction:
- By utilizing the DeNoised MA and de-noised price data, this indicator helps filter out minor fluctuations and focus on larger price movements, improving decision-making in volatile markets.
Centered Oscillators

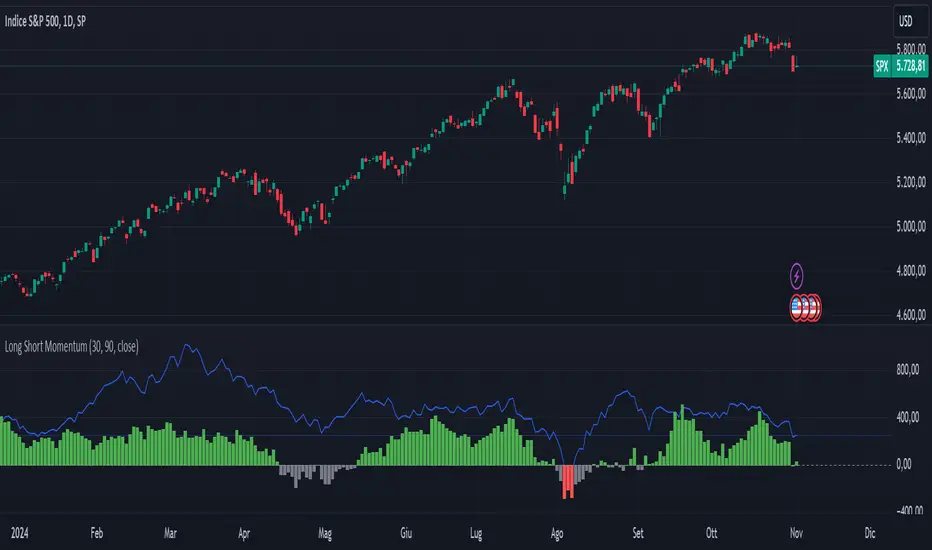
Long Short MomentumThis indicator is designed to visualize short-term and long-term momentum trends.The indicator calculates two momentum lines based on customizable lengths: a short momentum (Short Momentum) over a smaller period and a long momentum (Long Momentum) over a longer period. These lines are plotted relative to the chosen price source, typically the closing price.
The histogram, colored dynamically based on momentum direction, gives visual cues:
Green: Both short and long momentum are positive, indicating an upward trend.
Red: Both are negative, indicating a downward trend.
Gray: Mixed momentum, suggesting potential trend indecision.
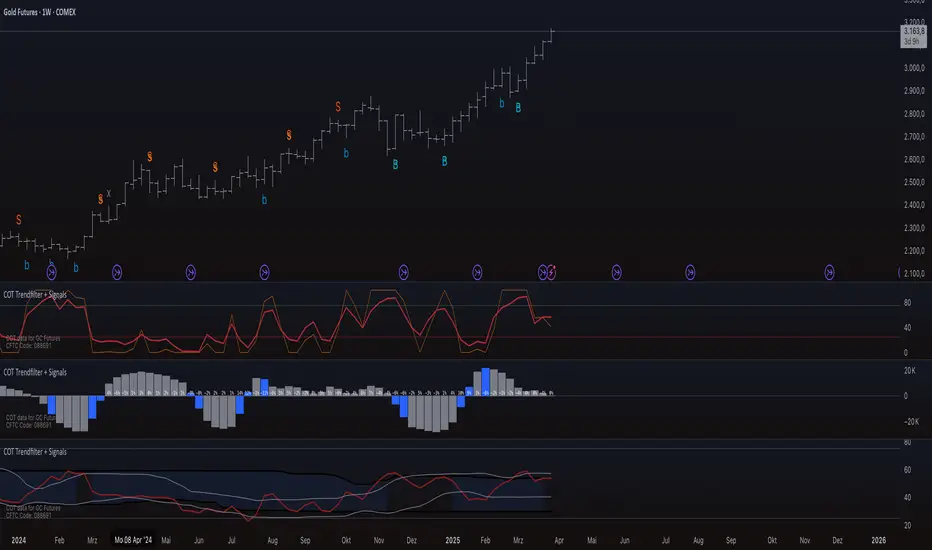
COT Trendfilter + SignalsCOT Trendfilter + Signals Indicator
Data Processing and Usage: The COT indicator processes Commitments of Traders (COT) data provided by the CFTC. Users can select from various participant groups, including Commercials, Large Speculators, and Small Speculators. However, it is important to note that the signal logic of the indicator is exclusively applicable to the net positions of Commercials. This is because Commercials tend to trade contrarily, meaning their trading decisions often run against the prevailing market trend.
Functionality of the Indicators
1. Cycle COT
The cCOT is an enhanced version of the classic RSI. It incorporates additional smoothing based on market vibrations, along with adaptive upper and lower bands based on cyclical memory. The cCOT uses the current dominant cycle length as input and highlights trading signals when the signal line crosses above or below the adaptive bands. Compared to the standard RSI, the cCOT responds more quickly to market movements.
For detailed information on the cCOT, please refer to Chapter 4 "Fine tuning technical indicators" in the book "Decoding the Hidden Market Rhythm, Part 1" by Lars von Thienen.
2. Adaptive Ultra-Smooth Momentum Indicator
The Adaptive Ultra-Smooth Momentum Indicator (CSI) provides an optimized momentum oscillator based on the current dominant cycle. It addresses three common issues with standard indicators: excessive false signals, signal delay, and the need for length adjustments. The CSI offers adaptive smoothing, zero delay, and accurate detection of turning points.
For further information about the CSI, please refer to Chapter 10 "Cycle Swing Indicator: Trading the swing of the dominant cycle" in the book "Decoding the Hidden Market Rhythm, Part 1" by Lars von Thienen.
Signals and Validation
The indicator generates various trading signals:
cCOT:
A buy signal is indicated by an airplane emoji (🛫), while a sell signal is marked by another airplane emoji (🛬).
COT Momentum:
A buy signal is shown by the symbol “∿” in green, while a sell signal is represented by the same symbol in red.
Standard COT Index (Willco):
A buy signal is depicted by a “B” (in green), while a sell signal is shown by an “S” (in red).
Additionally, the validity of the signals is checked. If a previous signal becomes invalid in the following week, it is marked with a gray “x,” indicating that these signals may not be reliable. Users can also switch between net positions, long, and short to analyze the most relevant data for them.
Background Color
The color in the channel can indicate the strength of the Commercials' long-term trend. A channel background color signals an active long-, short-term trend, while no color suggests that there is no clear long-term trend present.
Strange behavior
When only a sharp spike is displayed and the rest is flat, the length settings of the Cycle Length Index should be increased. This can occur when the length is too short, resulting in an unusual spike to properly generate the channel.
Disclaimer
The use of this indicator and the generated signals is at your own risk. The author assumes no responsibility for trading decisions made based on these signals. Please be aware that trading financial instruments involves risks.
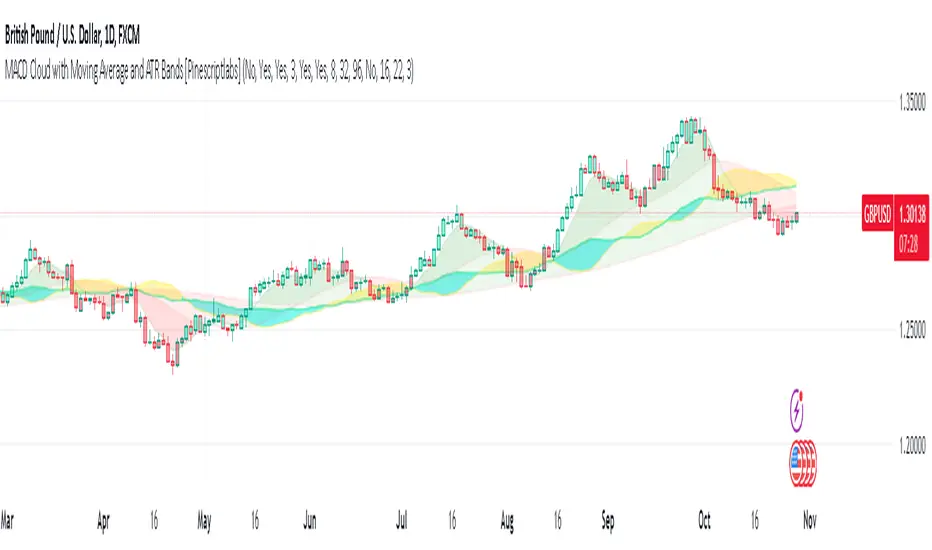
MACD Cloud with Moving Average and ATR BandsThe algorithm implements a technical analysis indicator that combines the MACD Cloud, Moving Averages (MA), and volatility bands (ATR) to provide signals on market trends and potential reversal points. It is divided into several sections:
🎨 Color Bars:
Activated based on user input.
Controls bar color display according to price relative to ATR levels and moving average (MA).
Logic:
⚫ Black: Potential bearish reversal (price above the upper ATR band).
🔵 Blue: Potential bullish reversal (price below the lower ATR band).
o
🟢 Green: Bullish trend (price between the MA and upper ATR band).
o
🔴 Red: Bearish trend (price between the lower ATR band and MA).
o
📊 MACD Bars:
Description:
The MACD Bars section is activated by default and can be modified based on user input.
🔴 Red: Indicates a bearish trend, shown when the MACD line is below the Signal line (Signal line is a moving average of MACD).
🔵 Blue: Indicates a bullish trend, shown when the MACD line is above the Signal line.
Matching colors between MACD Bars and MACD Cloud visually confirms trend direction.
MACD Cloud Logic: The MACD Cloud is based on Moving Average Convergence Divergence (MACD), a momentum indicator showing the relationship between two moving averages of price.
MACD and Signal Lines: The cloud visualizes the MACD line relative to the Signal line. If the MACD line is above the Signal line, it indicates a potential bullish trend, while below it suggests a potential bearish trend.
☁️ MA Cloud:
The MA Cloud uses three moving averages to analyze price direction:
Moving Average Relationship: Three MAs of different periods are plotted. The cloud turns green when the shorter MA is above the longer MA, indicating an uptrend, and red when below, suggesting a downtrend.
Trend Visualization: This graphical representation shows the trend direction.
📉 ATR Bands:
The ATR bands calculate overbought and oversold limits using a weighted moving average (WMA) and ATR.
Center (matr): Shows general trend; prices above suggest an uptrend, while below indicate a downtrend.
Up ATR 1: Marks the first overbought level, suggesting a potential bearish reversal if the price moves above this band.
Down ATR 1: Marks the first oversold level, suggesting a possible bullish reversal if the price moves below this band.
Up ATR 2: Extends the overbought range to an extreme, reinforcing the possibility of a bearish reversal at this level.
Down ATR 2: Extends the oversold range to an extreme, indicating a stronger bullish reversal possibility if price reaches here.
Español:
El algoritmo implementa un indicador de análisis técnico que combina la nube MACD, promedios móviles (MA) y bandas de volatilidad (ATR) para proporcionar señales sobre tendencias del mercado y posibles puntos de reversión. Se divide en varias secciones:
🎨 Barras de Color:
- Activado según la entrada del usuario.
- Controla la visualización del color de las barras según el precio en relación con los niveles de ATR y el promedio móvil (MA).
- **Lógica:**
- ⚫ **Negro**: Reversión bajista potencial (precio por encima de la banda superior ATR).
- 🔵 **Azul**: Reversión alcista potencial (precio por debajo de la banda inferior ATR).
- 🟢 **Verde**: Tendencia alcista (precio entre el MA y la banda superior ATR).
- 🔴 **Rojo**: Tendencia bajista (precio entre la banda inferior ATR y el MA).
### 📊 Barras MACD:
- **Descripción**:
- La sección de barras MACD se activa por defecto y puede modificarse según la entrada del usuario.
- 🔴 **Rojo**: Indica una tendencia bajista, cuando la línea MACD está por debajo de la línea de señal (la línea de señal es una media móvil de la MACD).
- 🔵 **Azul**: Indica una tendencia alcista, cuando la línea MACD está por encima de la línea de señal.
- La coincidencia de colores entre las barras MACD y la nube MACD confirma visualmente la dirección de la tendencia.
### 🌥️ Nube MACD:
- **Lógica de la Nube MACD**: Basada en el indicador de convergencia-divergencia de medias móviles (MACD), que muestra la relación entre dos medias móviles del precio.
- **Líneas MACD y de Señal**: La nube visualiza la relación entre la línea MACD y la línea de señal. Si la línea MACD está por encima de la de señal, indica una tendencia alcista potencial; si está por debajo, sugiere una tendencia bajista.
### ☁️ Nube MA:
- **Relación entre Medias Móviles**: Se trazan tres medias móviles de diferentes períodos. La nube se vuelve verde cuando la media más corta está por encima de la más larga, indicando una tendencia alcista, y roja cuando está por debajo, sugiriendo una tendencia bajista.
- **Visualización de Tendencias**: Proporciona una representación gráfica de la dirección de la tendencia.
### 📉 Bandas ATR:
- Las bandas ATR calculan límites de sobrecompra y sobreventa usando una media ponderada y el ATR.
- **Centro (matr)**: Muestra la tendencia general; precios por encima indican tendencia alcista y debajo, bajista.
- **Up ATR 1**: Marca el primer nivel de sobrecompra, sugiriendo una reversión bajista potencial si el precio sube por encima de esta banda.
- **Down ATR 1**: Marca el primer nivel de sobreventa, sugiriendo una reversión alcista potencial si el precio baja por debajo de esta banda.
- **Up ATR 2**: Amplía el rango de sobrecompra a un nivel extremo, reforzando la posibilidad de reversión bajista.
- **Down ATR 2**: Extiende el rango de sobreventa a un nivel extremo, sugiriendo una reversión alcista más fuerte si el precio alcanza esta banda.
Nova Volume Indicator (NVI) by SplitzMagicNova Volume Indicator
The Nova Volume Indicator is an innovative trading tool designed to enhance your trading strategy by analysing volume momentum and market dynamics. This indicator empowers traders to make informed decisions by providing clear and actionable buy and sell signals based on real-time data.
How It Works:
The Nova Volume Indicator utilizes advanced algorithms to assess volume changes and price movements. Key features include:
Volume Momentum Calculation: By evaluating the relationship between price changes and volume, the indicator identifies significant momentum shifts, enabling traders to pinpoint entry and exit points with precision.
Trend Direction Filter: The indicator includes a price filter that determines the prevailing market trend based on a moving average. This ensures that trades align with the overall market direction, enhancing the probability of success.
Alert System: With customizable alert thresholds, users receive notifications when momentum crosses defined levels, keeping them informed of potential trading opportunities without the need for constant monitoring.
No Trade Signal: A black background on the histogram indicates that there are no valid trading opportunities at that moment. Use this feature to avoid entering trades during uncertain market conditions.
How to Use the Nova Volume Indicator for Entries:
Identifying the Trend: Before making any trades, check the indicator's trend direction. If the price is above the moving average, focus on bullish signals; if below, look for bearish signals.
Spotting Entries:
Buy Signal: Look for a green histogram bar indicating positive volume momentum. Enter a trade at the close of the candle when the momentum score exceeds your alert threshold and the price is above the moving average.
Sell Signal: A red histogram bar signals negative volume momentum. Enter a short position at the close of the candle when the momentum score falls below the alert threshold and the price is below the moving average.
Setting Stops and Targets: Place your stop-loss below the recent swing low for buy trades or above the recent swing high for sell trades. Aim for a minimum 1:2 risk-to-reward ratio to maximize your profitability.
Customizable Settings:
The Nova Volume Indicator offers several input settings to help you tailor the indicator to your unique trading style:
Signal Period: Adjust the period for calculating the signal line (EMA of momentum score). A shorter period reacts quickly, while a longer one smooths the signals.
Volatility Period: Control the lookback period for assessing market volatility. Shorter periods capture recent fluctuations, and longer periods provide a broader view of price behavior.
Price Filter MA Length: Set the period for the moving average used to filter trades based on price action, helping determine the trend direction.
Alert Threshold: Define the level at which the indicator signals potential buying or selling opportunities. Customize this setting to suit your trading preferences.
The Nova Volume Indicator is a powerful addition to any trader’s toolkit, designed to simplify decision-making and improve trading outcomes. Whether you're a beginner or a seasoned trader, this indicator offers the insights you need to navigate the markets confidently. Explore its customizable features to create a unique trading experience tailored to your needs. Start using the Nova Volume Indicator today and elevate your trading journey!
Any questions you may have or if you have anything to input to improve this then please leave a comment.

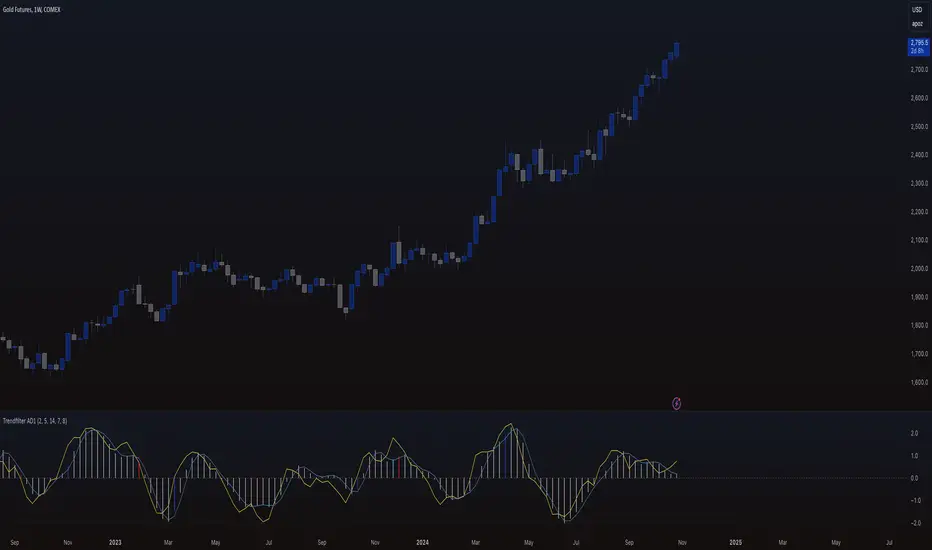
Trendfilter AD1
The "Trendfilter AD1" indicator is a versatile tool for trend detection that combines volume changes, price ranges, ATR (Average True Range), and moving averages. It also considers the momentum of True High/Low over a specified period (PROFF). The indicator integrates various mathematical calculations to measure market trends and volatility. Key features include the use of Powerbar colors, which indicate significant activity from large market participants.
Trendfilter LW
The Trendfilter LW section of the script calculates trend strength by comparing short-term and long-term simple moving averages (SMA) of closing prices, and by assessing cumulative price differences. The result is displayed as a histogram, with positive values indicating bullish trends and negative values indicating bearish trends. This helps traders visualize the strength and direction of long-term and short-term trends.
Trendfilter SP
The Trendfilter SP section combines volume changes, ATR data, and Z-score calculations to smooth out trend signals and provide a clearer assessment of market trends. It uses these data points to filter out noise and highlight significant trend changes. The combined Z-score, smoothed by an EMA, offers precise trend indications and helps traders identify whether the prevailing market forces are bullish or bearish.
What is it for?
The indicator helps traders identify trends and assess market volatility. By combining volume and price movements, it highlights potential trend reversals and shifts in market strength. The calculation of True High/Low (PROFF) measures market momentum over a set period, providing insights into price dynamics. The indicator also uses color-coded bars to represent different levels of market activity and trend strength, with Powerbar colors specifically highlighting major market moves driven by large traders.
How is it used?
Traders can customize the indicator through settings such as Volume Change Periods, EMA periods, and the True High/Low period (PROFF). The indicator generates signals based on significant volume and price fluctuations, with trends displayed through color-coded bars. The Trendfilter LW section calculates trend strength using SMA and cumulative price differences, while the Trendfilter SP section combines volume and ATR data with Z-score calculations to smooth out trend signals. These elements together provide a clear picture of market direction and strength.
EMA Ribbon + ADX MomentumHere's a description for your TradingView indicator publication:
The EMA Ribbon + ADX Momentum indicator combines exponential moving averages (EMA) with the Average Directional Index (ADX) to identify strong trends and potential trading opportunities. This powerful tool offers:
🎯 Key Features:
EMA Ribbon (10, 21, 34, 55) for trend direction
ADX integration for trend strength confirmation
Clear visual signals with color-coded backgrounds
Real-time trend status display
Strength metrics with exact percentage values
📊 How It Works:
EMA Ribbon: Four EMAs form a ribbon pattern that shows trend direction through their stacking order
ADX Integration: Confirms trend strength when above the threshold (default 25)
Visual Signals:
Green background: Strong bullish trend
Red background: Strong bearish trend
Gray background: Neutral or weak trend
📈 Trading Signals:
STRONG BULL: EMAs properly stacked bullish + high ADX + DI+ > DI-
STRONG BEAR: EMAs properly stacked bearish + high ADX + DI- > DI+
BULL/BEAR TREND: Shows regular trend conditions without strength confirmation
NEUTRAL: No clear trend structure
🔧 Customizable Parameters:
ADX Length: Adjust trend calculation period
ADX Threshold: Modify strength confirmation level
ADX Panel Toggle: Show/hide the ADX indicator panel
💡 Best Uses:
Trend following strategies
Entry/exit timing
Trade confirmation
Market structure analysis
Risk management tool
This indicator helps traders identify not just trend direction, but also trend strength, making it particularly useful for both position entry timing and risk management. The clear visual signals and real-time metrics make it suitable for traders of all experience levels.
Note: As with all technical indicators, best results are achieved when used in conjunction with other forms of analysis and proper risk management.

EMD Oscillator (Zeiierman)█ Overview
The Empirical Mode Decomposition (EMD) Oscillator is an advanced indicator designed to analyze market trends and cycles with high precision. It breaks down complex price data into simpler parts called Intrinsic Mode Functions (IMFs), allowing traders to see underlying patterns and trends that aren’t visible with traditional indicators. The result is a dynamic oscillator that provides insights into overbought and oversold conditions, as well as trend direction and strength. This indicator is suitable for all types of traders, from beginners to advanced, looking to gain deeper insights into market behavior.
█ How It Works
The core of this indicator is the Empirical Mode Decomposition (EMD) process, a method typically used in signal processing and advanced scientific fields. It works by breaking down price data into various “layers,” each representing different frequencies in the market’s movement. Imagine peeling layers off an onion: each layer (or IMF) reveals a different aspect of the price action.
⚪ Data Decomposition (Sifting): The indicator “sifts” through historical price data to detect natural oscillations within it. Each oscillation (or IMF) highlights a unique rhythm in price behavior, from rapid fluctuations to broader, slower trends.
⚪ Adaptive Signal Reconstruction: The EMD Oscillator allows traders to select specific IMFs for a custom signal reconstruction. This reconstructed signal provides a composite view of market behavior, showing both short-term cycles and long-term trends based on which IMFs are included.
⚪ Normalization: To make the oscillator easy to interpret, the reconstructed signal is scaled between -1 and 1. This normalization lets traders quickly spot overbought and oversold conditions, as well as trend direction, without worrying about the raw magnitude of price changes.
The indicator adapts to changing market conditions, making it effective for identifying real-time market cycles and potential turning points.
█ Key Calculations: The Math Behind the EMD Oscillator
The EMD Oscillator’s advanced nature lies in its high-level mathematical operations:
⚪ Intrinsic Mode Functions (IMFs)
IMFs are extracted from the data and act as the building blocks of this indicator. Each IMF is a unique oscillation within the price data, similar to how a band might be divided into treble, mid, and bass frequencies. In the EMD Oscillator:
Higher-Frequency IMFs: Represent short-term market “noise” and quick fluctuations.
Lower-Frequency IMFs: Capture broader market trends, showing more stable and long-term patterns.
⚪ Sifting Process: The Heart of EMD
The sifting process isolates each IMF by repeatedly separating and refining the data. Think of this as filtering water through finer and finer mesh sieves until only the clearest parts remain. Mathematically, it involves:
Extrema Detection: Finding all peaks and troughs (local maxima and minima) in the data.
Envelope Calculation: Smoothing these peaks and troughs into upper and lower envelopes using cubic spline interpolation (a method for creating smooth curves between data points).
Mean Removal: Calculating the average between these envelopes and subtracting it from the data to isolate one IMF. This process repeats until the IMF criteria are met, resulting in a clean oscillation without trend influences.
⚪ Spline Interpolation
The cubic spline interpolation is an advanced mathematical technique that allows smooth curves between points, which is essential for creating the upper and lower envelopes around each IMF. This interpolation solves a tridiagonal matrix (a specialized mathematical problem) to ensure that the envelopes align smoothly with the data’s natural oscillations.
To give a relatable example: imagine drawing a smooth line that passes through each peak and trough of a mountain range on a map. Spline interpolation ensures that line is as smooth and close to reality as possible. Achieving this in Pine Script is technically demanding and demonstrates a high level of mathematical coding.
⚪ Amplitude Normalization
To make the oscillator more readable, the final signal is scaled by its maximum amplitude. This amplitude normalization brings the oscillator into a range of -1 to 1, creating consistent signals regardless of price level or volatility.
█ Comparison with Other Signal Processing Methods
Unlike standard technical indicators that often rely on fixed parameters or pre-defined mathematical functions, the EMD adapts to the data itself, capturing natural cycles and irregularities in real-time. For example, if the market becomes more volatile, EMD adjusts automatically to reflect this without requiring parameter changes from the trader. In this way, it behaves more like a “smart” indicator, intuitively adapting to the market, unlike most traditional methods. EMD’s adaptive approach is akin to AI’s ability to learn from data, making it both resilient and robust in non-linear markets. This makes it a great alternative to methods that struggle in volatile environments, such as fixed-parameter oscillators or moving averages.
█ How to Use
Identify Market Cycles and Trends: Use the EMD Oscillator to spot market cycles that represent phases of buying or selling pressure. The smoothed version of the oscillator can help highlight broader trends, while the main oscillator reveals immediate cycles.
Spot Overbought and Oversold Levels: When the oscillator approaches +1 or -1, it may indicate that the market is overbought or oversold, signaling potential entry or exit points.
Confirm Divergences: If the price movement diverges from the oscillator's direction, it may indicate a potential reversal. For example, if prices make higher highs while the oscillator makes lower highs, it could be a sign of weakening trend strength.
█ Settings
Window Length (N): Defines the number of historical bars used for EMD analysis. A larger window captures more data but may slow down performance.
Number of IMFs (M): Sets how many IMFs to extract. Higher values allow for a more detailed decomposition, isolating smaller cycles within the data.
Amplitude Window (L): Controls the length of the window used for amplitude calculation, affecting the smoothness of the normalized oscillator.
Extraction Range (IMF Start and End): Allows you to select which IMFs to include in the reconstructed signal. Starting with lower IMFs captures faster cycles, while ending with higher IMFs includes slower, trend-based components.
Sifting Stopping Criterion (S-number): Sets how precisely each IMF should be refined. Higher values yield more accurate IMFs but take longer to compute.
Max Sifting Iterations (num_siftings): Limits the number of sifting iterations for each IMF extraction, balancing between performance and accuracy.
Source: The price data used for the analysis, such as close or open prices. This determines which price movements are decomposed by the indicator.
-----------------
Disclaimer
The information contained in my Scripts/Indicators/Ideas/Algos/Systems does not constitute financial advice or a solicitation to buy or sell any securities of any type. I will not accept liability for any loss or damage, including without limitation any loss of profit, which may arise directly or indirectly from the use of or reliance on such information.
All investments involve risk, and the past performance of a security, industry, sector, market, financial product, trading strategy, backtest, or individual's trading does not guarantee future results or returns. Investors are fully responsible for any investment decisions they make. Such decisions should be based solely on an evaluation of their financial circumstances, investment objectives, risk tolerance, and liquidity needs.
My Scripts/Indicators/Ideas/Algos/Systems are only for educational purposes!

Volume-Adjusted Schaff Trend Cycle (VASTC)Volume-Adjusted Schaff Trend Cycle (VASTC)
The VASTC is a fairly fast-moving oscillator designed to identify trends early and signal when trends may be nearing their end. While it can be used for both trend-following and mean-reversion strategies , it shines in trend-following setups. It’s particularly useful for catching the start of a trend and giving early warnings that a trend might end soon, making it a valuable addition to a multi-indicator system.
How It Works:
The VASTC adapts the traditional Schaff Trend Cycle by adjusting the MACD component with volume data. This volume-adjusted MACD is run through two stochastic processes , applying exponential smoothing to enhance responsiveness. Volume sensitivity allows the VASTC to adapt dynamically to periods of high or low trading activity, providing more reliable trend signals.
Recommended Use:
Use VASTC in confluence with other indicators to confirm trend entries and exits. It’s best for identifying early trend setups rather than sustaining prolonged trend trades. When used alongside other indicators, especially those with a longer-term outlook or momentum based trend indicators, you’ll gain a clearer signal for potential exits or entries. Always backtest the VASTC on your chosen assets to determine the most effective input parameters, as the defaults may not suit all markets or assets. Different assets behave differently, and adjustments in parameters can improve its ability to analyze the assets you're looking at.
Parameters:
Length : Sets the primary smoothing length.
Fast/Slow Length : Adjust the speed of the volume-adjusted MACD component.
Factor : Controls the final smoothing applied to the STC.
Overbought/Oversold Levels : Defines overbought/oversold levels.
Experiment with these settings to customize the VASTC to your trading strategy and asset.
Disclaimer : This indicator is a tool to complement your trading analysis and should not be used in isolation. Always backtest and use other confluence signals for best results. The assets I looked at when making this indicator are almost certainly different than what you're looking at.

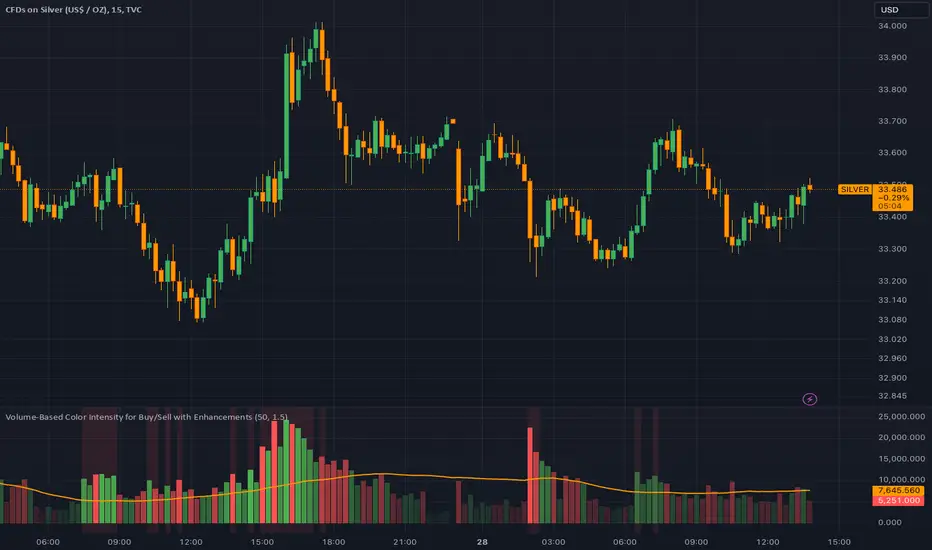
Dynamic Volume-Based Buy/Sell IndicatorThis script provides a powerful volume-based indicator that visualizes buy and sell volumes, issues alerts for volume spikes, and adjusts color intensity dynamically based on volume size. It includes customizable settings for volume averaging and thresholds, making it adaptable to various trading strategies.
Divergence for Many Indicators v4 Screener▋ INTRODUCTION:
The “Divergence for Many Indicators v4 Screener” is developed to provide an advanced monitoring solution for up to 24 symbols simultaneously. It efficiently collects signals from multiple symbols based on the “ Divergence for Many Indicators v4 ” and presents the output in an organized table. The table includes essential details starting with the symbol name, signal price, corresponding divergence indicator, and signal time.
_______________________
▋ CREDIT:
The divergence formula adapted from the “ Divergence for Many Indicators v4 ” script, originally created by @LonesomeTheBlue . Full credit to his work.
_______________________
▋ OVERVIEW:
The chart image can be considered an example of a recorded divergence signal that occurred in $BTCUSDT.
_______________________
▋ APPEARANCE:
The table can be displayed in three formats:
1. Full indicator name.
2. First letter of the indicator name.
3. Total number of divergences.
_______________________
▋ SIGNAL CONFIRMATION:
The table distinguishes signal confirmation by using three different colors:
1. Not-Confirmed (Orange): The signal is not confirmed yet, as the bar is still open.
2. Freshly Confirmed (Green): The signal was confirmed 1 or 2 bars ago.
3. Confirmed (Gray): The signal was confirmed 3 or more bars ago.
_______________________
▋ INDICATOR SETTINGS:
Section(1): Table Settings
(1) Table location on the chart.
(2) Table’s cells size.
(3) Chart’s timezone.
(4) Sorting table.
- Signal: Sorts the table by the latest signals.
- None: Sorts the table based on the input order.
(5) Table’s colors.
(6) Signal Confirmation type color. Explained above in the SIGNAL CONFIRMATION section
Section(2): Divergence for Many Indicators v4 Settings
As seen on the Divergence for Many Indicators v4
* Explained above in the APPEARANCE section
Section(3): Symbols
(1) Enable/disable symbol in the screener.
(2) Entering a symbol.
_______________________
▋ FINAL COMMENTS:
For best performance, add the Screener indicator to an active symbol chart, such as QQQ, SPY, AAPL, BTCUSDT, ES, EURUSD, etc., and avoid mixing symbols from different market allocations.
The Divergence for Many Indicators v4 Screener indicator is not a primary tool for making trading decisions.

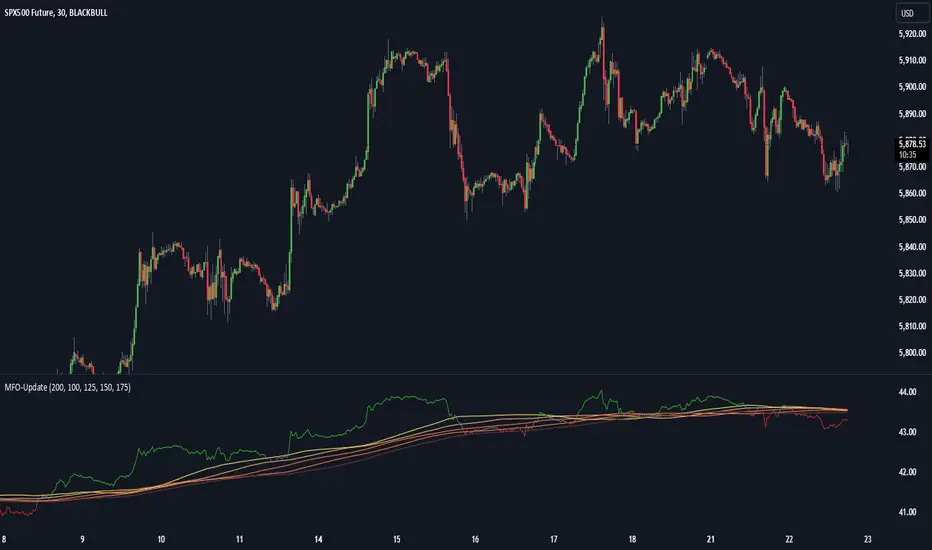
Momentum Flow OscillatorIndicator Overview: Momentum Flow Oscillator (MFO)
The Momentum Flow Oscillator (MFO) is a powerful tool for detecting shifts in market momentum. It combines a momentum-based calculation with a dynamic ribbon of moving averages to help traders identify trend reversals, continuations, and market consolidations. The MFO offers a clear visual representation of market conditions and assists traders in making informed decisions based on the relationship between momentum and its underlying trends.
The MFO line (green) is plotted alongside a Base Line (black) and a series of moving averages (ribbon). The ribbon is composed of five moving averages of different lengths, which allow traders to spot trends, momentum shifts, and potential trade opportunities. It is important to note that the ribbon tends to be a slower-moving component of the indicator, providing long-term trend signals rather than quick, reactive signals.
Components of the Indicator:
Momentum Flow Index (MFI):
This green line is the core of the indicator, representing market momentum derived from price and volume action. It reacts to changes in market dynamics and helps identify periods of strength and weakness.
Base Line (Black Line):
The black line is a 200-period moving average of the momentum flow. This acts as a dynamic support/resistance level for the MFI, smoothing out the price action over a longer period and providing a clearer trend signal.
Moving Averages Ribbon:
The ribbon is composed of five moving averages with different periods (100, 125, 150, 175, and 200). These moving averages create a visual "ribbon" that helps identify trends and consolidations, allowing traders to visualize the market’s momentum over different time frames.
The ribbon acts as a slower-moving indicator, helping to confirm long-term trends. Traders should keep in mind that the ribbon provides signals with a lag, making it ideal for trend-following rather than quick, short-term trades.
How to Use the Momentum Flow Oscillator (MFO):
1. Bullish Momentum Signals:
When the MFI (green line) crosses above the Base Line and the SMA ribbon, it indicates increasing momentum in the market. This signal is particularly strong when the MFI stays above the ribbon for an extended period.
Trade Example: Traders can use this as a buy signal when the MFI crosses above the ribbon, indicating that momentum is shifting to the upside. If the ribbon starts fanning out, it suggests the market is trending strongly upward, which may support a long position.
2. Bearish Momentum Signals:
When the MFI crosses below the Base Line and the SMA ribbon, it signals decreasing momentum. This is a bearish sign, indicating that the market may be preparing for a downturn.
Trade Example: A trader can use the cross below the ribbon as a sell signal or consider entering a short position when momentum weakens. If the ribbon fans out in a downward direction, it suggests the market is trending lower, and a short position may be warranted.
3. Neutral or Caution Signals:
When the MFI fluctuates within the SMA ribbon or crosses in and out frequently, the market may be in a consolidation phase or range-bound. In this situation, the trend is uncertain, and momentum is not strong enough to break decisively in either direction.
Trade Example: Traders may want to avoid taking new positions when the MFI is moving sideways within the ribbon, as this indicates indecision in the market. Waiting for a breakout above or below the ribbon can provide clearer signals for trading.
4. Trend Confirmation with Ribbon Expansion:
When the SMA ribbon expands, it indicates strong momentum in the direction of the trend. A clear widening of the ribbon with the MFI above (bullish) or below (bearish) signals a strong, sustainable trend.
Trade Example: As the ribbon expands, it confirms the strength of the trend, and traders can use this as confirmation to either hold an existing position or add to it.
5. Reversal Signals from Ribbon Contraction:
When the SMA ribbon contracts or the MFI crosses back and forth over the Base Line, it signals a potential reversal or a weakening of the existing trend.
Trade Example: In these cases, traders might consider closing positions or preparing for a reversal, as the contraction often signals a potential breakout in the opposite direction.
Example of Using the MFO in Trading:
In the provided chart image, you can see the MFI moving below the Base Line and the SMA ribbon for an extended period. This indicates bearish momentum, and traders could use this signal to enter a short position or avoid long positions until the MFI shows signs of crossing back above the ribbon. When the MFI crosses above the ribbon, it can signal a potential bullish reversal, indicating it might be time to re-enter long positions or close short positions.
Additional Trading Tips:
Combine with Other Indicators: The MFO can be used in combination with other technical tools such as volume-based indicators, trendlines, or oscillators like RSI or MACD to confirm signals and increase accuracy.
Use Different Time Frames: Traders can apply the MFO on different time frames (e.g., daily, weekly) to capture both short-term and long-term trends. Crossovers in longer time frames provide stronger confirmation of trend direction.
Conservative Entry: For more conservative traders, waiting for the MFI to fully cross above or below the ribbon (rather than within it) can help filter out false signals and avoid entering trades during consolidation phases.
Conclusion:
The Momentum Flow Oscillator offers traders a versatile and visual approach to gauging market momentum and trend strength. By observing the interaction between the MFI and the SMA ribbon, traders can spot trend changes early, confirm existing trends, and stay out of choppy, sideways markets. Keep in mind that the ribbon is a slower-moving part of the indicator—perfect for trend-following strategies but less ideal for fast, reactive trades. Use this indicator to increase your confidence in your trading decisions and improve your ability to capture trends in the market.
3CRGANG - HISTOGRAMThe 3CRGANG - HISTOGRAM is a breakthrough tool, developed to consolidate multiple oscillators, including their Fibonacci-modified versions, into a single, streamlined indicator. This isn’t just a combination of tools—i t’s a carefully engineered solution built to address the nuanced challenges traders face, such as market noise, varying data availability, and trend alignment across multiple timeframes.
Behind the scenes, significant debugging ensures it performs flawlessly even in situations where volume data isn’t provided by brokers. With automatic adjustments that adapt to different conditions, the indicator allows traders to remain focused on decision-making. Every enhancement, from signal optimization to noise reduction, reflects careful design choices to provide practical, actionable insights.
This tool is designed to give traders clarity, speed, and an edge, enabling them to focus on the markets without worrying about technical details.
How It’s Different from Basic Indicators
Rather than simply mashing up popular indicators like MACD, RSI, and more , —it’s a strategic tool designed to detect key momentum shifts, divergences, and trends in real time.
This script combines Fibonacci-modified oscillators and classic indicators in a unique way, providing multi-dimensional insights to enhance your trading decisions.
Reduce market noise: Fast and slow averages are used to generate histograms that filter out false signals.
Optimize alerts: Fibonacci-based calculations fine-tune oscillators to detect trends at key turning points.
Multi-timeframe momentum: This allows for tracking higher timeframe momentum while making decisions on lower timeframes—a powerful feature for trend alignment.
Key Features and Unique Value
Oscillator Flexibility: Choose from multiple oscillators to fit your strategy, including both momentum-based and volatility-based approaches.
Fibonacci Enhancements: These versions increase precision, providing greater confidence in signals at critical levels.
MTF Compatibility: Analyze higher timeframe momentum on shorter charts to maintain alignment with the broader trend.
Custom Alerts: Color-coded histograms and moving averages provide visual cues to keep your trades in sync with momentum changes.
How It Works
The indicator plots fast and slow averages for the selected oscillator, and the difference between these averages forms the histogram. Custom color coding shows whether momentum is increasing or weakening. The proprietary modification factor adjusts the signal sensitivity, allowing traders to fine-tune the indicator for their strategy.
Visual Alerts:
Green Bars: Indicate bullish momentum.
Red Bars: Suggest bearish momentum.
Buy Only / Sell Only Zones: Alert traders when the indicator suggests favoring either long or short trades.
This indicator minimizes false signals by blending momentum oscillators with volume-weighted filters and smooth moving averages, ensuring better signal quality.
Use Case: Like a Traffic Light for Your Trades
Green means Go: Enter or hold long positions during green bars, signaling upward momentum.
Red means Stop (or Go Short): Exit long positions or enter short trades when red bars appear, indicating bearish momentum.
The Buy Only and Sell Only alerts help traders stay aligned with dominant trends and avoid counter-trend trades in high-momentum phases.
Real-World Examples :
Divergences (BTCUSD):
When the price action ranges, wedges, or behaves unusually, the histogram—being highly sensitive — alerts traders ahead of potential reversals or continuation moves.
This gives traders more time to assess market conditions and prepare their strategy before momentum shifts.
Multi-Timeframe Momentum (ADAUSD):
Momentum from a higher timeframe aligns with the trend on a lower timeframe, helping traders time their entries accurately.
The Priceless Edge for Traders
The 3CRGANG offers more than just another way to analyze markets—it provides a priceless edge by streamlining multiple indicators into a single tool. With the flexibility to switch between oscillators, multi-timeframe momentum tracking, and proprietary enhancements, it’s designed to help traders stay ahead in both trending and volatile markets.
Disclaimer
This indicator is a trading tool designed to provide insights into market trends, but it does not guarantee results. Trading involves risk, and past performance does not predict future outcomes. Use it alongside proper risk management practices.

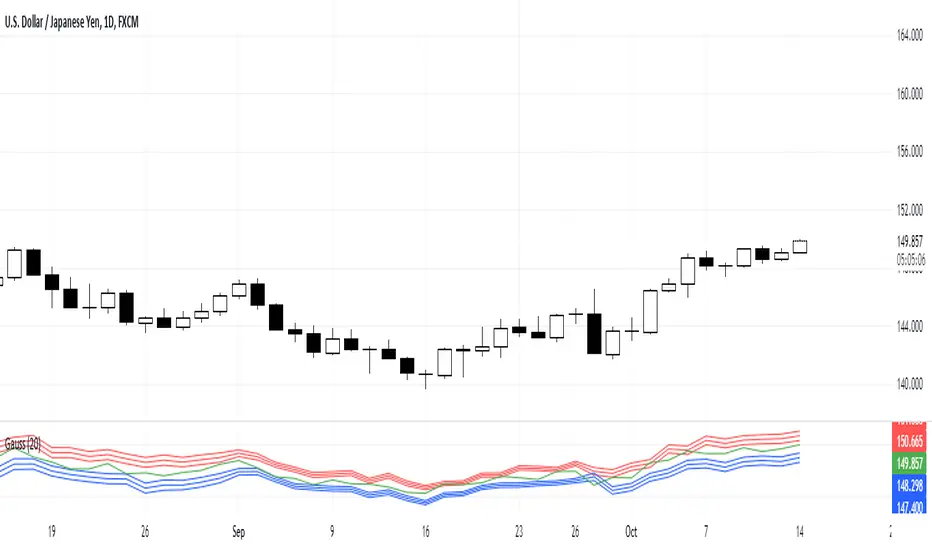
Gauss IndicatorGauss Indicator
Class : oscillator
Trading type : any
Time frame : any
Purpose : reversal trading
Level of aggressiveness : any
About Gauss Indicator
Time series forecasting is quite a scientific task, for which specific econometrical models and methods have been developed.
Who is Gauss and Why his Curve is So Important
Johann Gauss was one of the best mathematicians of all times and he gave us a very specific curve (Gaussian Curve) to explain specifics of random variable behavior (so called Normal Distribution)
Gaussian curve has quite interesting property usually called “3 Sigmas Rule”: in a normal distribution: 68%, 95%, and 99.7% of the values lie within one, two, and three standard deviations of the mean, respectively.
But Does It Work in the Financial Markets?
Normal Distribution is extremely typical for price behavior in financial markets: FOREX, stock Market, Commodities, Cryptocurrency market.
How can we forecast future prices based on “3 Sigmas Rule”?
If we know past prices (we actually know), we can calculate Mean and Standard Deviation.
After that following “3 Sigmas Rules” we can calculate the fluctuations range for the present day with a known probability (!).
• If we add 1 sigma to mean we can get the price value that wouldn’t be exceeded with a probability of 68%.
• If we add 2 sigmas to mean we can get the price value that wouldn’t be exceeded with a probability of 95%.
• If we add 3 sigmas to mean we can get the price value that wouldn’t be exceeded with a probability of 99%.
How Can I Get This Information?
Gauss indicator is a practical implementation of “3 sigmas rule” in trading.
Gauss allows to predict the ranges of price fluctuations for the selected time frames (week, day, hour, etc) with certain probabilities: 68%, 95% and 99%.
Gauss can be used to generate Trading signals, Stop-loss parameters, Take-profit parameters, Synthetic Levels (both Support and Resistance).
Actually, ALL information you need to trade.
Structure of the Gauss Indicator
1. Three blue lines – synthetic support lines. They describe 3 different buy zones with certain probabilities of success:
- First blue line (Buy zone #1) - the price today will not fall below this mark with a probability of 68%;
- Second blue line (Buy zone #2) - the price today will not fall below this mark with a probability of 95%;
- Third blue line (Buy zone #3) - the price today will not fall below this mark with a probability of 99%.
2. Three red lines – synthetic resistance lines. They describe 3 different sell zones with certain probabilities of success:
- First red line (Sell zone #1) - the price today will not rise above this mark with a probability of 68%;
- Second red line (Sell zone #2) - the price today will not rise above this mark with a probability of 95%;
- Third red line (Sell zone #3) - the price today will not rise above this mark with a probability of 99%.
3. Green line – shows current price. When it gets close to the red/blue line sell/buy signals are generated.
Trading rules
General rules are as follows: buy at the blue lines, sell at the red lines.
Take-profits for sells are set at the nearest blue line, for buys – at the nearest red line. Stop-losses for sells are set above the last red line, for buys – below the last blue line.
Hawk Algo ProHawk Pro Algo: The Ultimate Smart Money & Trend Detection Tool
Hawk Pro Algo is a powerful trading indicator designed to help traders track institutional money movements, detect trend reversals, and generate precise buy/sell signals. By leveraging advanced algorithms, volume analysis, divergence detection, and dynamic gradient features, Hawk Pro Algo gives you the edge needed to navigate both trending and ranging markets with confidence.
Smart Money Detection
Hawk Pro Algo goes beyond standard indicators by focusing on tracking the movements of smart money (large institutional trades). This feature identifies key moments when significant players are entering or exiting the market, enabling you to align your trades with those of the most influential market participants.
Institutional Buy Signals: These signals occur when strong upward momentum, backed by large institutional buying, is detected. It gives you a clear sign that the market is about to rally.
Institutional Sell Signals: On the flip side, sell signals are generated when institutional selling pressure emerges, allowing you to exit positions before a significant drop.
These signals ensure that you're trading in sync with the smart money, maximizing your opportunities for profitable trades.
Buy & Sell Signals: Multiple Entry/Exit Points
Hawk Pro Algo comes equipped with multiple layers of buy and sell signals, giving traders the flexibility to spot different types of trading opportunities:
1. Diamond Buy & Sell Signals
Buy Diamonds: A green diamond appears when a combination of bullish signals, such as a strong price pattern and institutional buying pressure, align. These are ideal for capturing market upswings after confirmation.
Sell Diamonds: A red diamond is plotted when bearish conditions take over. This is a clear indicator that institutional sellers are driving the market down, signaling an ideal moment to exit.
2. CCI Cross Signals
CCI Buy Signals: Triggered when the Commodity Channel Index (CCI) crosses above a certain threshold, indicating a shift in momentum to the upside. This is visualized with a green cross, signaling a strong entry opportunity.
CCI Sell Signals: Similarly, when the CCI crosses below a threshold, a red cross is plotted, signaling the momentum has shifted downward, and it’s time to consider exiting.
3. Circle Buy & Sell Signals
Buy Circles: A green circle appears when the market is ready to reverse from a downward trend, confirming a strong buying opportunity. This is often combined with oversold conditions in the CCI to further validate the entry.
Sell Circles: A red circle is shown when the market is ready to correct or reverse after an upward movement. It confirms an ideal exit point to lock in profits before the market pulls back.
4. Trigger Signals
Buy Triggers: Trigger signals indicate moments of market manipulation or sudden dips in price, where a reversal could be imminent. These signals suggest that the market could rally after a short-lived price drop.
Sell Triggers: These are moments where downward manipulation is detected, warning traders of a potential sell-off or correction after a price spike.
Gradient CCI Oscillator: Dynamic Trend Strength with Overbought and Oversold Detection
The Gradient CCI Oscillator is one of the most unique aspects of Hawk Pro Algo. It combines momentum detection with visual cues to show trend strength and potential reversal points. The CCI doesn’t just indicate regular overbought and oversold levels—it provides a dynamic gradient transition to help you gauge market momentum.
Overbought and Oversold Glow
Potential Reversals (Glow Signals)
When the market is reaching critical overbought or oversold levels, Hawk Pro Algo uses a pink glow on the CCI to signal potential reversals:
Pink Glow (Overbought): When the CCI turns pink, the market is nearing a potential reversal from overbought conditions. It suggests caution and may be a signal to prepare for a downturn.
Pink Glow (Oversold): Conversely, a pink glow in oversold conditions signals a potential upward reversal, providing an early warning to get ready for a bullish move.
Three CCI Color Logics: Momentum and Reversal Detection
Hawk Pro Algo features a three-step gradient system that helps you visualize trend strength and detect potential reversals. This tricolor CCI logic transitions smoothly between green, white, and red, giving traders a deeper understanding of market dynamics.
#1: Red → White → Green Transition (and vice versa)
Green: Indicates strong bullish momentum. The CCI turns green when the market is in a strong upward trend, especially after recovering from oversold levels.
White: Represents a neutral zone, showing that momentum is fading or in transition. When the CCI is between overbought and oversold levels, the indicator turns white, signaling indecision or a potential upcoming shift in trend.
Red: Indicates strong bearish momentum. The CCI turns red when the market is under selling pressure or in an overbought state, signaling potential weakness.
This color transition allows you to see when momentum is shifting from bullish to bearish (or vice versa) and helps you time your entries and exits with greater precision.
ETHUSDT.P 8H
#2: Flippable Gradient CCI
For added flexibility, Hawk Pro Algo allows you to flip the CCI gradient colors to suit your personal preference:
By default, the gradient transitions from green (bullish) to red (bearish).
By flipping the gradient, you can reverse this visualization, with red indicating bullish momentum and green signaling bearish conditions.
This feature ensures that the CCI display aligns with your individual trading style, providing a clearer picture of market conditions.
#3: Overbought/Oversold Color Logic
When the CCI crosses into overbought or oversold territory, the color transitions to help you stay on top of extreme market conditions:
Darker Red for overbought levels, helping you recognize when the market may be due for a reversal.
Deeper Green for oversold levels, signaling potential buying opportunities as the market reaches exhaustion.
These color shifts ensure that traders are visually alerted to key moments in the market, helping to avoid buying at the top or selling at the bottom.
Trigger Signals: Detecting Market Manipulation
The trigger signals in Hawk Pro Algo are designed to detect potential market manipulation—moments when artificial price moves occur before a larger trend shift. These signals help protect you from false breakouts or breakdowns.
Buy Triggers: These occur when the indicator detects potential upward manipulation, helping you prepare for a rally after a price dip.
Sell Triggers: Conversely, sell triggers indicate potential downward manipulation, alerting you to a possible sell-off after a price spike.
These signals act as early warnings, helping you avoid getting caught in manipulated price action and positioning you for better trade entries.
Divergence Detection: Pinpointing Reversals with real time Confidence
Hawk Pro Algo excels in divergence detection, identifying both regular and hidden divergences. Divergences occur when price action and the oscillator (CCI) are out of sync, signaling potential reversals.
Bullish Divergence: This occurs when the price is making lower lows, but the CCI is making higher lows. It suggests that downward momentum is weakening, and a reversal could be imminent. In this case, wait for the CCI to turn green to confirm that the bullish divergence is playing out before entering a trade.
Bearish Divergence: This happens when the price is making higher highs, but the CCI is making lower highs, signaling that upward momentum is weakening. Wait for the CCI to turn red to confirm that the bearish divergence is unfolding, and then consider entering a short trade.
By waiting for the CCI color to change (green for bullish divergence, red for bearish divergence), you ensure that the divergence is confirmed before taking action, leading to higher-confidence trades.
How It All Works Together
The combination of CCI color transitions, overbought/oversold detection, smart money signals, and trigger manipulations makes Hawk Pro Algo a comprehensive tool for traders of all skill levels:
Trend Strength: The CCI gradient provides instant visual feedback on the strength of the current trend, helping you gauge when to stay in a trade or prepare for a reversal.
Reversal Signals: The color-coded overbought/oversold signals help you spot key moments when the market may reverse, while divergence detection adds another layer of confidence to your entries.
Smart Money Flow: Follow the institutional money with precision buy/sell signals based on volume and trend strength, ensuring that you're aligned with

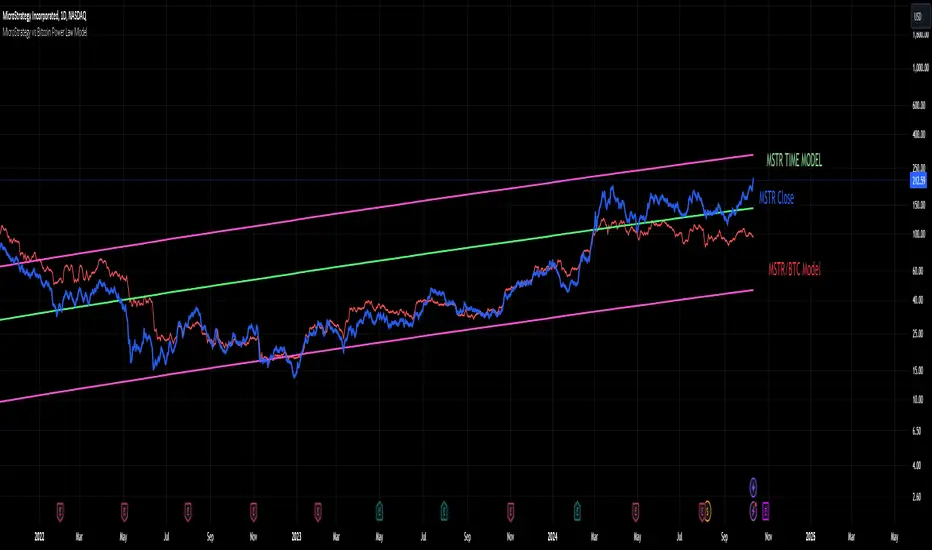
MicroStrategy vs Bitcoin Power Law Model
This indicator provides a powerful tool for investors by modeling the relationship between MicroStrategy (MSTR) and Bitcoin (BTC) based on an observed power law correlation since August 2020, when MSTR adopted Bitcoin as its core investment strategy. The primary objective of the indicator is to identify areas where MSTR is overvalued or undervalued relative to BTC, offering investors crucial insights for making informed decisions.
Step-by-Step Creation Process:
Data Collection:
The indicator begins by gathering historical price data for both MSTR and BTC starting from August 2020. This period is significant as it marks MSTR’s strategic shift toward Bitcoin acquisition.
Power Law Analysis:
A power law relationship between MSTR and BTC is computed using a power of 1.3. This relationship models the price behavior of MSTR relative to BTC, providing a framework to track where MSTR’s price deviates from its expected value based on BTC's movements.
MSTR Price Model:
The MSTR price model based on this power law is then plotted against the actual price of MSTR. This allows investors to visualize areas where MSTR is potentially overvalued or undervalued relative to BTC.
Overvaluation is highlighted when the actual MSTR price exceeds the power law-based price, while undervaluation is noted when it falls below.
Time-Based Power Law Model:
Additionally, the indicator integrates a time-based model for MSTR, which shows that MSTR follows its own power law over time with a higher slope than BTC (7.2 vs. 5.8). This comparison provides further context, showing how MSTR's growth rate differs from BTC’s over time.
Oscillator Inclusion:
To complement the price models, an oscillator is added, which tracks the difference between the MSTR power law and the BTC power law. This oscillator helps visualize and quantify the divergence between the two, offering a clearer picture of periods where MSTR is performing above or below expectations compared to BTC.
Indicator Usefulness:
Overvaluation and Undervaluation Detection: By comparing MSTR’s current price against its expected power law-based price, investors can easily identify potential entry and exit points. When MSTR is overvalued relative to BTC, it may signal an opportunity to sell or reduce exposure. Conversely, undervaluation may suggest a buying opportunity.
Time-Based Growth Comparisons: The time-based power law model shows how MSTR has been growing relative to Bitcoin over time. This helps investors understand whether MSTR is outperforming or underperforming BTC in the long run.
Divergence Oscillator: The oscillator provides an intuitive way to gauge whether MSTR is significantly diverging from BTC’s growth trajectory, offering an additional signal to guide investment decisions.
Projections to the future
Projections of the MSTR power law to 500 days ahead is also included.
Why is this Indicator Useful for Investors?
This indicator offers a comprehensive view of how MSTR’s price behavior correlates with Bitcoin. By leveraging the power law relationship, it provides insight into whether MSTR is priced appropriately relative to BTC, which is especially valuable for those with exposure to both assets. The oscillator further refines this analysis by highlighting periods of divergence, offering potential trading opportunities based on relative value.
Momentum Nexus Oscillator [UAlgo]The "Momentum Nexus Oscillator " indicator is a comprehensive momentum-based tool designed to provide traders with visual cues on market conditions using multiple oscillators. By combining four popular technical indicators—RSI (Relative Strength Index), VZO (Volume Zone Oscillator), MFI (Money Flow Index), and CCI (Commodity Channel Index)—this heatmap offers a holistic view of the market's momentum.
The indicator plots two lines: one representing the current chart’s combined momentum score and the other representing a higher timeframe’s (HTF) score, if enabled. Through smooth gradient color transitions and easy-to-read signals, the Momentum Nexus Heatmap allows traders to easily identify potential trend reversals or continuation patterns.
Traders can use this tool to detect overbought or oversold conditions, helping them anticipate possible long or short trade opportunities. The option to use a higher timeframe enhances the flexibility of the indicator for longer-term trend analysis.
🔶 Key Features
Multi-Oscillator Approach: Combines four popular momentum oscillators (RSI, VZO, MFI, and CCI) to generate a weighted score, providing a comprehensive picture of market momentum.
Dynamic Color Heatmap: Utilizes a smooth gradient transition between bullish and bearish colors, reflecting market momentum across different thresholds.
Higher Timeframe (HTF) Compatibility: Includes an optional higher timeframe input that displays a separate score line based on the same momentum metrics, allowing for multi-timeframe analysis.
Customizable Parameters: Adjustable RSI, VZO, MFI, and CCI lengths, as well as overbought and oversold levels, to match the trader’s strategy or preference.
Signal Alerts: Built-in alert conditions for both the current chart and higher timeframe scores, notifying traders when long or short entry signals are triggered.
Buy/Sell Signals: Displays visual signals (▲ and ▼) on the chart when combined scores reach overbought or oversold levels, providing clear entry cues.
User-Friendly Visualization: The heatmap is separated into four sections representing each indicator, providing a transparent view of how each contributes to the overall momentum score.
🔶 Interpreting Indicator:
Combined Score
The indicator generates a combined score by weighing the individual contributions of RSI, VZO, MFI, and CCI. This score ranges from 0 to 100 and is plotted as a line on the chart. Lower values suggest potential oversold conditions, while higher values indicate overbought conditions.
Color Heatmap
The indicator divides the combined score into four distinct sections, each representing one of the underlying momentum oscillators (RSI, VZO, MFI, and CCI). Bullish (greenish) colors indicate upward momentum, while bearish (grayish) colors suggest downward momentum.
Long/Short Signals
When the combined score drops below the oversold threshold (default is 26), a long signal (▲) is displayed on the chart, indicating a potential buying opportunity.
When the combined score exceeds the overbought threshold (default is 74), a short signal (▼) is shown, signaling a potential sell or short opportunity.
Higher Timeframe Analysis
If enabled, the indicator also plots a line representing the combined score for a higher timeframe. This can be used to align lower timeframe trades with the broader trend of a higher timeframe, providing added confirmation.
Signals for long and short entries are also plotted for the higher timeframe when its combined score reaches overbought or oversold levels.
🔶Purpose of Using Multiple Technical Indicators
The combination of RSI, VZO, MFI, and CCI in the Momentum Nexus Heatmap provides a comprehensive approach to analyzing market momentum by leveraging the unique strengths of each indicator. This multi-indicator method minimizes the limitations of using just one tool, resulting in more reliable signals and a clearer understanding of market conditions.
RSI (Relative Strength Index)
RSI contributes by measuring the strength and speed of recent price movements. It helps identify overbought or oversold levels, signaling potential trend reversals or corrections. Its simplicity and effectiveness make it one of the most widely used indicators in technical analysis, contributing to momentum assessment in a straightforward manner.
VZO (Volume Zone Oscillator)
VZO adds the critical element of volume to the analysis. By assessing whether price movements are supported by significant volume, VZO distinguishes between price changes that are driven by real market conviction and those that might be short-lived. It helps validate the strength of a trend or alert the trader to potential weakness when price moves are unsupported by volume.
MFI (Money Flow Index)
MFI enhances the analysis by combining price and volume to gauge money flow into and out of an asset. This indicator provides insight into the participation of large players in the market, showing if money is pouring into or exiting the asset. MFI acts as a volume-weighted version of RSI, giving more weight to volume shifts and helping traders understand the sustainability of price trends.
CCI (Commodity Channel Index)
CCI contributes by measuring how far the price deviates from its statistical average. This helps in identifying extreme conditions where the market might be overextended in either direction. CCI is especially useful for spotting trend reversals or continuations, particularly during market extremes, and for identifying divergence signals.
🔶 Disclaimer
Use with Caution: This indicator is provided for educational and informational purposes only and should not be considered as financial advice. Users should exercise caution and perform their own analysis before making trading decisions based on the indicator's signals.
Not Financial Advice: The information provided by this indicator does not constitute financial advice, and the creator (UAlgo) shall not be held responsible for any trading losses incurred as a result of using this indicator.
Backtesting Recommended: Traders are encouraged to backtest the indicator thoroughly on historical data before using it in live trading to assess its performance and suitability for their trading strategies.
Risk Management: Trading involves inherent risks, and users should implement proper risk management strategies, including but not limited to stop-loss orders and position sizing, to mitigate potential losses.
No Guarantees: The accuracy and reliability of the indicator's signals cannot be guaranteed, as they are based on historical price data and past performance may not be indicative of future results.

Divergence Indicator Multi [TradingFinder] MACD AO RSI DIV Chart🔵 Introduction
🟣 What is Divergence in Financial Markets?
Divergence in technical analysis happens when the price of a stock moves in a direction opposite to certain indicators. This is a crucial concept in financial markets as it can signal either a trend reversal or a continuation of the current correction in the trend. Understanding divergence helps traders and analysts make more informed decisions.
🟣 Positive Regular Divergence (RD+)
A positive regular divergence occurs at the end of a downtrend, where two price lows form. This divergence appears when the price chart shows a new low, but the indicator does not follow, signaling potential buying opportunities.
Positive divergence indicates increased buying pressure and reduced selling pressure, making it a useful signal for forecasting price increases.
🟣 Negative Regular Divergence (RD-)
A negative regular divergence is seen during an uptrend when two price highs form. The price chart records a new high, but the indicator does not reflect this change, suggesting that a market downturn is likely.
This type of divergence shows strong selling pressure and weaker buying activity, which can help identify selling opportunities.
Both positive and negative divergences are powerful tools for identifying potential trend reversals and key support and resistance levels. For example, when an indicator trends upward while the price moves downward, this creates divergence, warning traders to reconsider their investment strategy.
🟣 Different Types of Divergence in Trading
1. Regular Divergence :
o Positive Regular Divergence (RD+)
o Negative Regular Divergence (RD-)
2. Hidden Divergence :
o Positive Hidden Divergence (HD+)
o Negative Hidden Divergence (HD-)
3.Time Divergence.
Note : This guide focuses specifically on Regular Divergence.
🟣 What is Regular Divergence?
Regular Divergence, often referred to as convergence, occurs when price action and indicators show conflicting patterns, usually signaling the end of a trend. Detecting regular divergence helps traders anticipate potential trend reversals or the formation of reversal patterns.
🔵 How to Use
To optimize the detection of divergence, you can adjust the Fractal Period to specify the length of time for identifying divergence patterns.
Additionally, with the Divergence Detection Method, you can select oscillators like the MACD, RSI, or AO to base divergence detection on.
Divergence in MACD :
MACD divergence occurs when the price chart forms an opposite pattern compared to the MACD line, indicating a potential price reversal.
Divergence in RSI :
In a downtrend, if the price chart forms two consecutive lows with the second lower than the first, but the RSI shows two lows with the second higher, this indicates positive regular divergence, which is a buy signal.
On the other hand, during an uptrend, if the price forms two highs with the second higher than the first, but the RSI shows the second high lower, this points to negative regular divergence, indicating a sell signal.
Divergence in AO (Awesome Oscillator) :
The AO indicator calculates histograms using the difference between 5-period and 34-period simple moving averages. It compares peaks and troughs of these histograms with price movements, detecting divergence and plotting lines and arrows to signal divergence.
🔵 Table
The following table breaks down the main features of the oscillator. It covers four critical categories: Exist, Consecutive, Divergence Quality, and Change Phase Indicator.
Exist : If divergence is detected, a "+" will appear in this row.
Consecutive: Shows the number of consecutive divergences that have formed in a short period.
Divergence Quality : Evaluates the quality of the divergence based on the number of occurrences. One is labeled "Normal," two are "Good," and three or more are considered "Strong."
Change Phase Indicator : If a phase change is detected between two oscillation peaks, this is marked in the table.

Pip hunter 1-Minute Scalping Strategy [manesisnet]NOTE: This is my first attempt to write an indicator using pine script and it's not recommended for serious trading, just use it for your own research or feel free to create your own versions based on the below.
Overview: The "1-Minute Scalping Strategy" is a custom TradingView indicator designed for short-term traders looking to capitalize on quick price movements in the 1-minute timeframe. This strategy combines moving averages and the Relative Strength Index (RSI) to generate buy and sell signals while filtering out potential false entries by confirming trends on a higher timeframe.
How It Works:
Moving Averages:
The indicator uses two Simple Moving Averages (SMAs):
A fast SMA (5-period) for short-term price movements.
A slow SMA (20-period) to identify the overall trend.
Buy signals are generated when the fast SMA crosses above the slow SMA, indicating bullish momentum.
Sell signals occur when the fast SMA crosses below the slow SMA, indicating bearish momentum.
Higher Time Frame Confirmation:
To enhance the accuracy of the signals, the strategy checks the trend on a higher timeframe (default is 5 minutes).
A buy signal is only valid if the current price is above the higher timeframe SMA, confirming that the overall trend is bullish.
A sell signal is only valid if the current price is below the higher timeframe SMA, confirming a bearish trend.
This confirmation helps avoid false breakouts and ensures that trades are aligned with the prevailing market direction.
Relative Strength Index (RSI):
The RSI is used to assess market momentum and potential reversal points.
The indicator calculates a 14-period RSI to identify overbought and oversold conditions.
For buy signals, the RSI must be below 60 (indicating the market is not overbought).
For sell signals, the RSI must be above 40 (indicating the market is not oversold).
This helps to filter out trades that might occur during extreme market conditions.
Visual Representation:
The fast SMA (5-period) is plotted in blue, the slow SMA (20-period) in red, and the higher timeframe SMA in orange.
Buy signals are indicated with a green label below the bar, while sell signals are indicated with a red label above the bar.
This visual representation allows traders to quickly identify potential entry points.
Alerts:
The script includes alert conditions for buy and sell signals, enabling traders to receive notifications when the conditions for entering trades are met.

Kurutoga Histogram with HTF and LTF
Kurutoga Histogram:
The Kurutoga Histogram is a technical analysis indicator designed to measure price divergence from the 50% level of a recent price range. By calculating how far the current price is from the midpoint of a selected base length of candles, the histogram provides insight into the momentum, strength, and potential reversals in the market. Additionally, it can be applied across multiple timeframes to provide a comprehensive view of both short- and long-term market dynamics.
Key Components:
Base Length:
The base length is the number of candles (bars) over which the high and low prices are observed. The default base length is typically 14 periods, but it can be adjusted according to the trader's preference.
This base length defines the range from which the 50% level, or midpoint, is calculated.
50% Level (Midpoint):
The midpoint is the average of the highest high and the lowest low over the selected base length. This 50% level acts as an equilibrium point around which the price fluctuates.
Formula:
Midpoint = (Highest High + Lowest Low) / 2
The price’s distance from this midpoint is an indicator of how strong the current trend or divergence is.
Price Divergence:
The main calculation of the histogram is the difference between the current closing price and the midpoint of the price range.
Formula:
Divergence = Close Price − Midpoint
A positive divergence (price above the midpoint) indicates bullish strength, while a negative divergence (price below the midpoint) indicates bearish strength.
Multi-Timeframe Analysis:
The Kurutoga Histogram can be applied to both the current timeframe and a higher timeframe (HTF), allowing traders to gauge price movement in both short-term and long-term contexts.
By comparing the histograms of multiple timeframes, traders can determine if there is alignment (confluence) between trends, which can strengthen trade signals or provide additional confirmation.
Color-Coded Histogram:
Blue Bars (Positive Divergence): Represent that the price is above the 50% level, indicating bullish momentum. Taller blue bars suggest stronger upward momentum, while shrinking bars suggest weakening strength.
Red Bars (Negative Divergence): Represent that the price is below the 50% level, indicating bearish momentum. Taller red bars suggest stronger downward momentum, while shrinking bars suggest a potential reversal or consolidation.
The histogram’s color intensity and transparency can be adjusted to enhance the visual effect, distinguishing between current timeframe (LTF) and higher timeframe (HTF) divergence.
Interpretation:
Bullish Signals: When the histogram bars are blue and growing, the price is gaining momentum above the midpoint of its recent range. This could signal an ongoing uptrend.
Bearish Signals: When the histogram bars are red and growing, the price is gaining momentum below the midpoint, signaling an ongoing downtrend.
Momentum Shifts: When the histogram bars shrink in size (whether blue or red), it could indicate that the current trend is losing strength and may reverse or enter consolidation.
Neutral or Sideways Movement: When the histogram bars hover around zero, it means the price is trading near the midpoint of its recent range, often signaling a lack of strong momentum in either direction.
Multi-Timeframe Confluence:
When the current timeframe (LTF) histogram aligns with the higher timeframe (HTF) histogram (e.g., both are showing strong bullish or bearish divergence), it may provide stronger confirmation of the trend's strength.
Divergence between timeframes (e.g., bullish on LTF but bearish on HTF) may suggest that price movements on lower timeframes are not yet reflected in the broader trend, signaling caution.
Applications:
Trend Identification: The Kurutoga Histogram is highly useful for detecting when the price is trending away from its equilibrium point, providing insight into the strength of ongoing trends.
Momentum Analysis: By measuring the divergence from the 50% level, the histogram helps traders identify when momentum is increasing or decreasing.
Reversal Detection: Shrinking histogram bars can signal weakening momentum, which often precedes trend reversals.
Consolidation and Breakouts: When the histogram remains near zero for an extended period, it suggests consolidation, which often precedes a breakout in either direction.
Advantages:
Clear Visuals: The use of a color-coded histogram makes it easy to visually assess whether the market is gaining bullish or bearish momentum.
Multi-Timeframe Utility: The ability to compare current timeframe signals with higher timeframe signals adds an extra layer of confirmation, reducing false signals.
Dynamic Adjustment: By adjusting the base length, traders can fine-tune the sensitivity of the indicator to match different markets or trading styles.
Limitations:
Lagging Indicator: Like most divergence indicators, the Kurutoga Histogram may lag slightly behind actual price movements, especially during fast, volatile markets.
Requires Confirmation: This indicator works best when used in conjunction with other technical tools like moving averages, support/resistance levels, or volume indicators, to avoid relying on divergence alone.
Conclusion:
The Kurutoga Histogram is a versatile and visually intuitive tool for measuring price divergence from a key equilibrium point, helping traders to assess the strength of trends and identify potential reversal points. Its use across multiple timeframes provides deeper insights, making it a valuable addition to any trading strategy that emphasizes momentum and trend following.
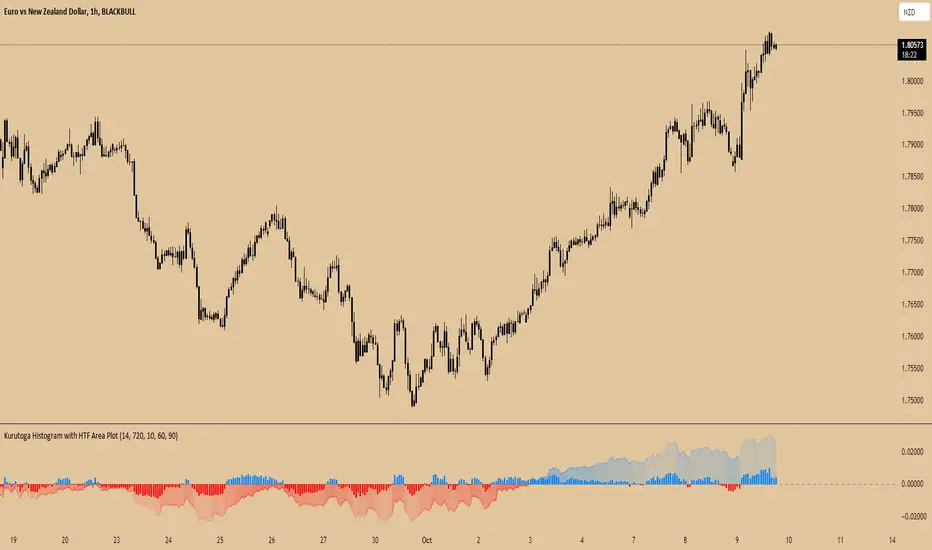
BRT MACD CustomBRT MACD Custom — Adaptive and Flexible MACD for Multi-Timeframe Analysis
The BRT MACD Custom is an advanced version of the traditional MACD indicator, offering additional flexibility and adaptability for multi-timeframe trading. This custom script allows traders to adjust the calculation parameters for MACD to suit their specific trading strategy, timeframe, and market conditions.
Key Features
Multi-Timeframe Support
Unlike the standard MACD, this indicator lets you choose a specific timeframe (different from the chart timeframe) for calculating MACD values. This feature provides more flexibility in analyzing market trends on multiple timeframes without changing the main chart.
Example: You can analyze MACD on a 15-minute timeframe even when your chart is set to 1-minute, giving you broader market insights.
Customizable EMA and Signal Settings
Users can adjust the fast and slow EMA lengths as well as the signal smoothing to better align with their preferred trading strategies. The script allows switching between the two popular types of moving averages — SMA or EMA — for both the MACD and the signal line.
Volatility-Based Adaptive EMA
The script includes an adaptive mechanism for EMA calculation. When the selected timeframe closes, the indicator dynamically adjusts the calculation, ensuring the MACD values respond quickly to market volatility. This makes the indicator more reactive compared to static MACD implementations.
Shift Options for MACD, Signal, and Histogram
The indicator allows shifting the MACD, signal line, and histogram values by one or more bars. This can be useful for backtesting and simulating strategies where you anticipate future price movements.
Signal Alerts for Long and Short Trades
The script generates visual signals when certain conditions are met, indicating potential long or short trade opportunities. These signals are based on MACD and histogram crossovers:
Long Signal: Triggered when MACD is above the signal line and both are rising.
Short Signal: Triggered when MACD is below the signal line and both are falling.
Custom Plotting
The MACD line, signal line, and histogram are plotted on the chart for easy visualization. The histogram changes colors to reflect positive or negative momentum:
Green shades when MACD is above the signal line.
Red shades when MACD is below the signal line.
Applications in Trading
The BRT MACD Custom is ideal for traders who need flexibility in their technical analysis. Its multi-timeframe capabilities and customizable moving averages make it suitable for day trading, swing trading, and long-term investing across a variety of markets.
Scalping: Use the 1-minute or 5-minute timeframe to identify short-term trends while calculating MACD on a higher timeframe such as 15 or 30 minutes.
Swing Trading: Apply the indicator on 1-hour or 4-hour charts to detect mid-term trends.
Long-Term Investing: Analyze daily or weekly charts with longer EMA periods to confirm market direction before making large investments.

Trend Following Regression CloudTrend Following Regression Cloud Indicator
The Trend Following Regression Cloud is a versatile trading tool designed to help you effortlessly identify the market's prevailing trend. By analyzing price movements over multiple time frames, it provides a clear visual representation of whether the market is trending upwards or downwards.
How It Works:
- Adaptive Analysis: The indicator calculates linear regression lines over various periods ranging from short-term to long-term (e.g., 10, 20, 50, up to 500 periods). This means it adapts quickly to recent market changes, capturing new trends as they develop.
- Noise Reduction: By comparing and weighting the slopes of these regression lines, it filters out insignificant price fluctuations (market noise). This ensures that the signals you receive are more reliable and less prone to false alarms.
- Cloud Calculation: The cloud is generated by first calculating the slopes of multiple linear regression lines over different lengths. The differences between the slopes of shorter-term and longer-term regressions are then computed and weighted by their respective lengths. By summing up these weighted differences, the indicator produces a "total distance" value. This value is applied to a baseline (such as a 100-period simple moving average) to create the cloud line. The area between the baseline and the cloud line is filled, and its color changes based on whether the total distance is positive or negative, providing a visual cue of the market's trend direction.
- Visual Representation: The indicator plots two lines—a base line and a cloud line—creating a shaded area (the "cloud") between them. The color of this cloud changes based on market conditions:
- Green Cloud: Indicates that short-term trends are stronger than long-term trends, suggesting an upward market movement. This could be a good time to consider buying.
- Red Cloud: Signifies that the market may be trending downwards, as long-term trends overpower short-term ones. This could be an opportune moment to consider selling.

RoC Momentum CycleRoC Momentum Cycles (RMC) is derived from RoC (Rate of Change) indicator.
Motivation behind RMC: Addressing RoC’s Shortcomings
While the Rate of Change (RoC) indicator is a valuable tool for assessing momentum, it has notable limitations that traders must be aware of. One of the primary challenges with the traditional RoC is its sensitivity to price fluctuations, which can lead to false signals in volatile markets. This often results in premature entries or exits, impacting trading performance.
By smoothing out the RoC calculations and focusing on more consistent signal generation (using SMA on smoothed RoC), RMC offers a more consistent representation of price trends.
Momentum Cycles
RMC helps visualize momentum cycles in a much better way compared to RoC.
Long Momentum Cycle : A cross-over of smoothed RoC (blue line) above averaged signal (orange line) below zero marks start of a new potential upside cycle which ends when the blue line comes back to zero line from above.
Short Momentum Cycle : A cross-under of blue line below orange line above zero marks beginning of a potential downside cycle which ends when the blue line comes back to zero from below.