Rejection Block DetectorRejection Block Detector
Rejection Block Detector is an indicator designed to automatically identify Rejection Blocks (SRB / LRB) — price levels where the market shows clear rejection and potential reaction.
The indicator detects:
Short Rejection Blocks (SRB) — bearish rejection zones
Long Rejection Blocks (LRB) — bullish rejection zones
Detection logic
Blocks are formed using a two-candle pattern, with precision controlled by the Tolerance parameter.
After a candidate block is detected, a Strength filter is applied, requiring the block’s key extremum to remain unbroken for a specified number of subsequent candles.
Higher Strength values result in:
fewer blocks
higher-quality, more significant levels
reduced market noise
Visualization and lifecycle
Each block is plotted as a horizontal line at its key level.
A block remains active until:
price reaches its key level
or its lifetime expires (Rejection blocks lifetime candles count)
Inactive blocks can either be:
hidden or displayed with reduced opacity using Show non actual rejection blocks
Alerts
The indicator provides alerts for:
Short Rejection Block formation
Long Rejection Block formation
First price touch of a Short Rejection Block
First price touch of a Long Rejection Block
These alerts allow traders to react to important price levels in real time without monitoring the chart continuously.
Use case
This indicator is well suited for traders who focus on:
price action
Smart Money Concepts
reaction and liquidity-based levels
The indicator does not repaint and does not generate trade signals — it highlights structural reaction levels to support informed decision-making.
Candlestick analysis

Ingenuity Crazy Strategy BasicThis indicator is a powerful tool, but results depend on using the correct settings.
To avoid guessing and wasting time, all optimized settings, updates, and live examples are shared inside our Discord.
👉 Join the Discord to get:
• The exact settings we use
• Market-specific presets
• Live trade breakdowns
• Ongoing updates and support
⚠️ Do not use default settings.
📌 Discord access is required for best performance.

Money Zones Institutional Kill RangesMoney Zones highlights the most important institutional trading windows where real volume enters the market. It automatically maps each session’s true high and low, giving traders a clear range. This tool is designed to help you focus only on the moments when the market is most likely to move with intention.

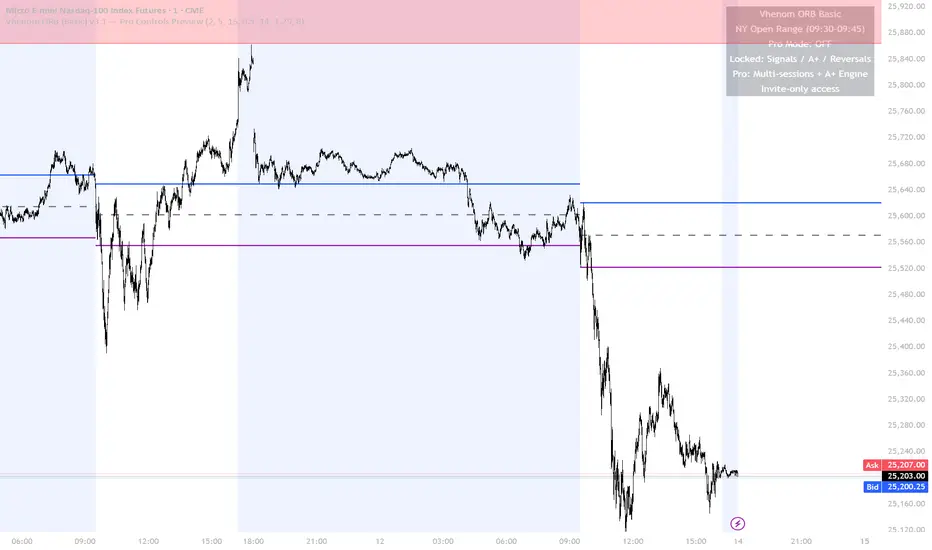
Vhenom ORB (Basic)Vhenom ORB (Basic)
Opening Range Levels for the NY Session
Vhenom ORB (Basic) is a clean, no-nonsense Opening Range indicator designed for traders who want clear NY session structure without clutter.
This version plots the Opening Range High, Low, and Midline for the 9:30–9:45 New York session, then extends those levels for the rest of the trading day so you can trade reactions, breakouts, and acceptance with clarity.
It’s intentionally simple, fast, and lightweight — perfect for discretionary traders who prefer to manage entries and risk manually.
What This Version Includes
• NY Session Opening Range (9:30–9:45 ET)
• ORB High, Low, and optional Midline
• Levels extend through the full trading day
• Previous ORBs remain on chart for context
• Custom colors, line width, and label controls
• No repainting, no signals, no noise
Who This Is For
• Futures, index, and day traders
• Traders who already understand ORB concepts
• Discretionary execution (you decide entries & exits)
• Anyone who wants structure without automation
What This Version Does Not Include
This Basic edition does not include:
• Breakout signals
• A+ momentum filtering
• Failed breakout (reversal) logic
• Multiple ORB sessions
• Advanced session controls
• Automated signal timing
Those features are intentionally reserved for the Professional version.
Looking for More?
If you want confirmed breakouts, A+ momentum filtering, failed breakout reversals (R Buy / R Sell), and multi-session ORBs, check out:
👉 Vhenom ORB A+ (Professional)
whop.com
The Professional version is invite-only and built for traders who want structured confirmation, not guesswork.
Final Notes
This script is designed as a foundation tool.
Trade it your way — combine it with your own execution, risk management, and higher-timeframe bias.
No claims. No hype. Just structure.
Sentinel System V1.1
Sentinel System – High-Probability Confluence Indicator (Non-Repainting)The Sentinel System is a powerful all-in-one indicator designed for traders who want clean, high-probability entries with minimal false signals. Built around the principle of multiple confluence, it combines trend filtering, momentum triggers, and dynamic price zones to deliver precise buy/sell arrows only when everything aligns.Key Features:Trend Filter: Uses EMA 50/200 to ensure signals only appear in the direction of the prevailing trend (no counter-trend noise).
Sentinel Trigger: Custom fast/slow momentum crossover optimized to catch the beginning of impulsive moves.
Sentinel Zones: Shaded dynamic areas based on recent pivots/fractals, mild overbought/oversold conditions, and relative strength. Signals are only validated inside these high-confluence zones.
Clean Arrows & Alerts: Non-repainting ↑ (long) and ↓ (short) arrows with pop-up, sound, and push alerts.
Confluence Dashboard: Small on-chart label showing signal strength (Strong / Medium / Weak).
Works on any timeframe and any asset – exceptional performance on volatile markets like BTC, ETH, XAU/USD, and major forex pairs.
Why traders love it:Extremely low false signal rate thanks to triple-layer confirmation.
Fully non-repainting – once an arrow appears, it stays.
Perfect for scalping (lower TFs) or swing trading (higher TFs).
Simple and clean visuals – no chart clutter.
Whether you're a beginner looking for reliable signals or an experienced trader seeking confluence confirmation, Sentinel System helps you stay on the right side of the market with confidence.Feel free to test it extensively – the results speak for themselves. Disclaimer: No indicator guarantees profits. Always use proper risk manageme
¿Cómo funciona?Combina tres capas de confirmación:Tendencia (EMA).
Momentum (trigger).
Zona de precio dinámica.
Solo cuando las tres coinciden, aparece una señal. Esto reduce mucho las entradas falsas.¿Para qué sirve?Funciona en cualquier timeframe y cualquier activo.
Destaca especialmente en mercados volátiles como Bitcoin (BTC), Ethereum (ETH), oro (XAU/USD) y pares mayores de forex.
Ideal para scalping (timeframes bajos) o swing trading (timeframes altos).
Perfecto para principiantes que buscan señales claras o traders avanzados que quieren confirmación extra.


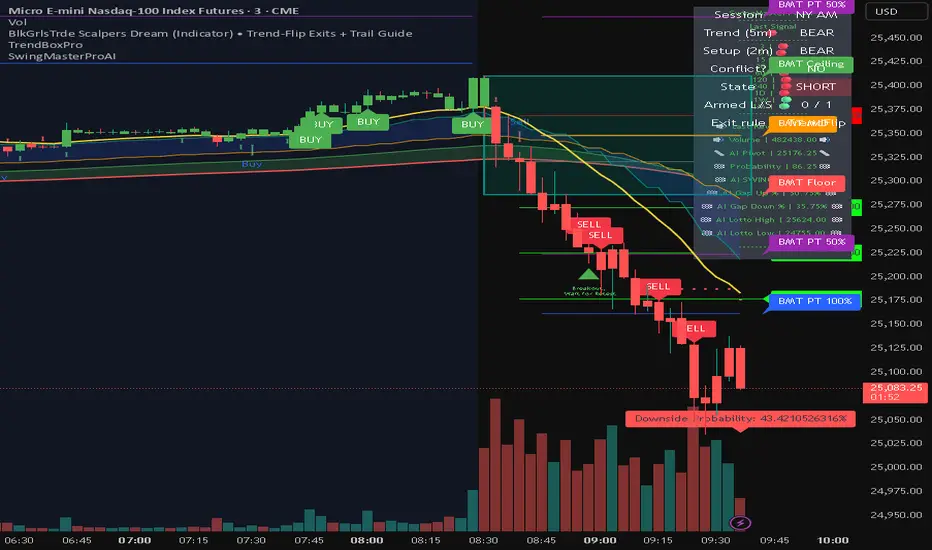
BlkGrlsTrde Scalpers DreamBlkGrlsTrde – Scalpers Dream (MNQ)
BlkGrlsTrde – Scalpers Dream is a discretionary scalping indicator designed specifically for Micro E-Mini Nasdaq (MNQ) traders who want clear, structured entries and exits without clutter or over-engineering.
This tool focuses on momentum continuation after key price reactions, helping traders stay aligned with higher-timeframe context while executing on lower timeframes such as the 1-minute chart.
What It Provides
Clear BUY and SELL signals for scalp entries
Structured trade levels with:
Stop level
TP1 (partial target)
TP2 (runner target)
Exit signals, including:
TP1 hit
TP2 hit
Stop hit
Exit on opposite signal
No-Trade (Conflict) state when conditions do not align, displayed clearly in gray so you know when to stand down
Session awareness for London, NY AM, and NY PM trading windows
On-chart status panel showing current market state at a glance
Designed For
MNQ scalpers
Traders who prefer structure but manual execution
Traders who want clarity over complexity
Live trading during active sessions without constant indicator stacking
How to Use
Best used on MNQ 1-minute charts
Take signals in the direction of the displayed bias
Manage risk using the plotted stop and targets
Stand aside during NO TRADE states
Use TP1 to reduce risk and TP2 for runners
This is an indicator, not an automated trading system. It is intended to support disciplined decision-making, not replace it.
Disclaimer
This indicator is for educational and informational purposes only. Trading futures involves substantial risk. Always manage risk appropriately and trade within your plan.
EBP Auto Fibonacci Drawer 👑 Daily EBP Trading Strategy (Final Refined Summary)
This is a daily price action strategy that combines a specific reversal candle (EBP) with a Fibonacci retracement for a confirmed trend continuation entry.
1. 🕯️ The Signal Candle (EBP Confirmation)
Wait for a single daily candle to close that meets two strict criteria:
Liquidity Sweep: The candle's low must first wick below the low of the preceding day.
Strong Reversal: The candle must then reverse and close above the high of the preceding day (confirming a strong move).
2. 📐 Fibonacci Retracement Setup
The Fibonacci Retracement tool is applied to the newly confirmed EBP Candle to define the retracement and entry zone for the next day.
Drawing the Fib (for a Buy Setup): Draw the Fib from the EBP Candle's Close to the EBP Candle's Low.
3. 🎯 Entry and Risk Management
The trade is executed on the next candle (Day 2) after the price retraces and then reverses, confirmed by a candle close.
Action Retracement & Entry Condition Stop Loss (SL) Placement Target (TP) Placement
Buy (Long) Price retraces into the Fib levels, and then the candle CLOSES above any of the key breakout levels: 0%, 25%, 50%, 75%, or 100%. Placed at the Most Recent Swing Low (The lowest point before the EBP candle's move). The EBP Candle's High Wick.
Sell (Short) (Inverse) Price retraces into the Fib levels, and then the candle CLOSES below any of the key breakout levels: 0%, 25%, 50%, 75%, or 100%. Placed at the Most Recent Swing High (The highest point before the EBP candle's move). The EBP Candle's Low Wick.
Export to Sheets
Key Takeaways:
Timeframe: Daily candles are used for all signals and entries.
Entry Trigger: A confirmed candle close outside the Fib level is required, not just a wick or price crossing.
Risk Control: The Stop Loss is set at a structural point (the recent swing) for better protection.
Would you like to search for examples of this "Engineered Block Pricing" (EBP) candle pattern on a chart? That clarification makes sense, as placing the Stop Loss (SL) at the recent swing low (or high for a short) is a more conservative and structurally sound location than just the immediate EBP candle's wick.
Here is the final, fully refined summary of the Daily EBP Trading Strategy, incorporating all criteria: the specific signal candle, the Fibonacci retracement levels, the candle close entry trigger, and the recent swing low/high for the stop loss.
👑 Daily EBP Trading Strategy (Final Refined Summary)
This is a daily price action strategy that combines a specific reversal candle (EBP) with a Fibonacci retracement for a confirmed trend continuation entry.
1. 🕯️ The Signal Candle (EBP Confirmation)
Wait for a single daily candle to close that meets two strict criteria:
Liquidity Sweep: The candle's low must first wick below the low of the preceding day.
Strong Reversal: The candle must then reverse and close above the high of the preceding day (confirming a strong move).
2. 📐 Fibonacci Retracement Setup
The Fibonacci Retracement tool is applied to the newly confirmed EBP Candle to define the retracement and entry zone for the next day.
Drawing the Fib (for a Buy Setup): Draw the Fib from the EBP Candle's Close to the EBP Candle's Low.
3. 🎯 Entry and Risk Management
The trade is executed on the next candle (Day 2) after the price retraces and then reverses, confirmed by a candle close.
Action Retracement & Entry Condition Stop Loss (SL) Placement Target (TP) Placement
Buy (Long)
Price retraces into the Fib levels, and then the candle CLOSES above any of the key breakout levels: 0%, 25%, 50%, 75%, or 100%.
Placed at the Most Recent Swing Low (The lowest point before the EBP candle's sharp move). The EBP Candle's High Wick.
Sell (Short) (Inverse) Price retraces into the Fib levels, and then the candle CLOSES below any of the key breakout levels: 0%, 25%, 50%, 75%, or 100%.
Placed at the Most Recent Swing High (The highest point before the EBP candle's sharp move). The EBP Candle's Low Wick.

Line9EMA+BOLL
The 9 EMA moving averages can be freely adjusted, and they are overlaid with the upper, middle, and lower bands of the Bollinger Bands.

Supply & Demand - Trading Vidhyalaya (Free)A powerful script that automatically plots Supply and Demand zones on your chart. Designed to help traders identify potential reversal areas with precision.
Free Version Capabilities:
Works exclusively on the Daily (1D) Timeframe.
Includes Wick & Strong validation logic.
📍 Pinpoint accurate reversals.
🔔 Real-time alerts for Daily zones.
📉 "Touched" zone logic to keep your chart clean.
Want to use this on Intraday Charts? The Premium version supports ALL Timeframes (1m to Monthly) and includes Multi-Timeframe (MTF) overlay capabilities.

Line6EMA+BOLL
The values of the six EMA moving averages can be freely adjusted, and it also integrates the upper, middle, and lower lines of the Bollinger Bands.

Vhenom ORB A+ (Professional)Vhenom ORB A+ (Professional)
Advanced Opening Range Breakout System with A+ Momentum & Failure Detection
What This Indicator Is
Vhenom ORB A+ (Professional) is a precision-built Opening Range Breakout system designed for active index futures traders who want early entries, objective confirmation, and protection against false breakouts.
This is not a generic ORB clone.
It is a multi-session, momentum-aware, reversal-aware trading framework built specifically to handle:
Explosive breakouts
Failed breakouts
Intraday continuation
Reversals back into range
Real-time decision-making (not just candle-close hindsight)
Core Philosophy
Most ORB indicators fail because they:
Only work at candle close
Treat all breakouts the same
Ignore volatility context
Provide no framework for failed moves
Vhenom ORB A+ solves all of that.
It does not tell you what to trade.
It tells you when conditions are objectively favorable.
🔹 Key Features
1️⃣ Multi-Session ORB Engine (NY Time)
Define ORBs across multiple intraday windows, not just the cash open:
NY Cash Open (09:30–09:45)
Midday Expansion
Power Hour
Evening Session
Overnight Sessions
Fully customizable ORB windows
Each ORB:
Draws High / Low / Midline in real time
Freezes when complete
Automatically rolls forward into the next session
No repainting of historical ORBs.
2️⃣ Real-Time Breakout Detection (Live Preview)
Unlike most indicators, Vhenom ORB A+ can signal intrabar:
Signals flicker live as price breaks the ORB
Signals confirm on candle close
If price re-enters the range, the signal disappears
This allows:
Earlier entries for aggressive traders
Confirmed entries for conservative traders
You choose.
3️⃣ A+ Momentum Engine (ATR-Based)
Not all breakouts are equal.
The A+ Engine measures candle expansion relative to ATR to identify true momentum breakouts.
When an A+ breakout occurs:
The candle is highlighted
The label upgrades to A+ Buy / A+ Sell
Optional filtering: require A+ for signals or use it as a visual upgrade
This helps eliminate:
Chop
Low-energy fake moves
Weak breakouts that stall immediately
4️⃣ Failure Mode (Reversal Detection)
This is where most ORB tools fall apart.
Vhenom ORB A+ actively monitors failed breakouts.
If price:
Breaks out of the ORB
Fails to hold
Re-enters the range within a defined window
The indicator generates:
R Buy (failed downside breakout)
R Sell (failed upside breakout)
With:
Acceptance-by-close logic
Minimum bar delay (no same-candle chaos)
Optional live preview
This allows traders to:
Capture reversals
Avoid chasing failed breakouts
Trade against trapped participants
5️⃣ Conflict Protection (No Mixed Signals)
The logic explicitly prevents:
Buy and Sell on the same candle
Breakout and reversal on the same bar
Overlapping signal noise
If a conflict ever exists:
Sell wins (conservative bias)
The system is intentionally opinionated to reduce indecision.
6️⃣ Candle Coloring for Immediate Context
Candle colors provide instant visual feedback:
A+ Breakout candles
Failed breakout reversal candles
Priority rules ensure clarity (Reversal > A+)
You can glance at the chart and know what just happened.
🔹 Designed For
This indicator is ideal for:
NQ / ES / MNQ / MES traders
GC / MGC traders
ORB, momentum, and reversal traders
Traders who scale quickly and manage stops tightly
Traders who want structure, not guesses
It works on any symbol or timeframe, but is optimized for index futures.
🔹 What This Is NOT
❌ Not a signal bot
❌ Not a “win every trade” system
❌ Not meant for set-and-forget trading
This tool gives high-quality decision points — execution is up to you.
🔹 Basic vs Professional
Basic Version
NY Cash Session ORB only
ORB lines only
No momentum logic
No reversals
Professional Version (This)
Multiple ORB sessions
Live breakout preview
A+ momentum detection
Failure / reversal detection
Advanced filtering & controls
Designed for real trading, not hindsight
🔹 Final Notes
This indicator was built by a trader, refined through real market behavior, and designed to expose opportunity and risk at the same time.
If you understand:
Opening ranges
Volatility
Acceptance vs rejection
Risk management
Vhenom ORB A+ gives you an edge — not a crutch.

APS - Sweeps & BOSThis indicator identifies pivot highs and lows, detects liquidity sweeps, and marks Break of Structure (BOS).
Key Features:
1) Pivot Detection :
The script uses configurable left and right bar parameters to identify significant pivot highs and lows, marking them with "X" labels on the chart. These pivots represent potential areas where price may react.
2) Sweep Detection :
A sweep occurs when price temporarily moves beyond a previous pivot level but closes back inside, suggesting a liquidity grab or stop hunt. The indicator draws horizontal lines connecting the original pivot to the sweep location and labels these events. Sweeps often precede reversals as they collect liquidity before moving in the opposite direction.
3) Break of Structure (BOS) :
BOS events are marked when price closes beyond a previous pivot level, indicating a potential shift in market structure. Bullish BOS occurs when price closes above a pivot high, while Bearish BOS occurs when price closes below a pivot low. These can signal continuation moves or trend changes.
4) Previous Day High/Low (PDH/PDL):
The indicator tracks the previous session's high and low (based on 6 PM ET session breaks, which auto-adjusts for DST) and displays whether these levels have been breached. It also calculates and displays a 50% equilibrium line between PDH and PDL.
5) Higher Timeframe Context :
A table in the top-right corner shows whether the higher timeframe close is in premium (above equilibrium) or discount (below equilibrium) territory. The HTF automatically adjusts based on your current timeframe.
6) Customization Options:
Adjustable pivot sensitivity (left/right bars)
Configurable sweep lookback period
Customizable colors, line styles, and label sizes for all elements
Toggle visibility for any component
Optional alerts for sweeps and BOS events
How to Use:
Sweeps near support/resistance often indicate liquidity grabs before reversals
BOS events can confirm directional bias changes
Use PDH/PDL levels as reference points for intraday trading
Consider HTF context when taking trades (discount zones for longs, premium zones for shorts)
Important Notes:
This indicator is designed for educational purposes and market analysis. Past patterns do not guarantee future results. Please follow proper risk management.

DMA % Movement vs Avg (v6)This script can give a directional guidance based on DMA trend. There is a small label which will indicate the % increment based on a look back period. Since we work as 200 DMA as ref. this is best used for daily and weekly charts only.
PS: DoesNOT work for monthly charts !!


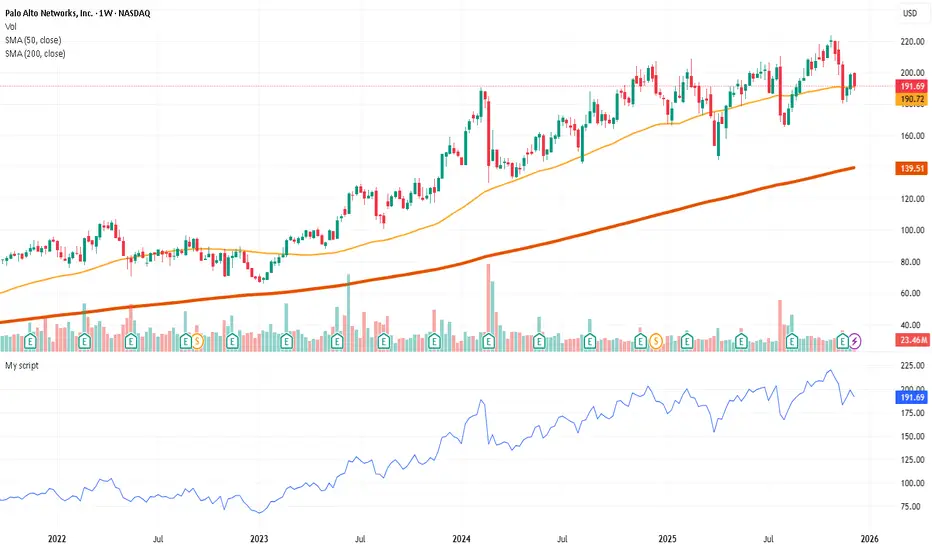
Multi-TF EMAs (50/100/200)This indicator plots 9 Exponential Moving Averages (EMAs) on your chart, combining three key EMA lengths (50, 100, 200) across three higher timeframes (Daily, Weekly, Monthly). This allows traders to identify dynamic support/resistance levels and trend direction across multiple timeframes without switching charts.

UK100 London Judas & IFVG SetupUK100 London Judas & IFVG Setup
Overview This indicator is a specialized trading tool designed to automate the ICT Judas Swing strategy specifically for the UK100 (FTSE 100) index during the London Market Open. It combines institutional time-based logic with price action confirmation using Inversion Fair Value Gaps (IFVG) to identify high-probability reversal setups.
How It Works The strategy is based on the concept that the initial move after the London Open is often a "fake-out" (manipulation) designed to trap retail traders and engineer liquidity before the true trend of the day begins.
Session & Opening Price:
The script marks the London Open price (default 09:00 Warsaw / 08:00 London time) with a dashed line.
This serves as the "line in the sand." Prices moving away from this line initially are monitored for manipulation.
Judas Swing (Liquidity Sweep):
If price moves BELOW the open, it is hunting Sell-Side Liquidity (trapping sellers).
If price moves ABOVE the open, it is hunting Buy-Side Liquidity (trapping buyers).
The Entry Trigger: Inversion FVG (IFVG):
The indicator scans for Fair Value Gaps (FVG) created during the manipulation phase.
BUY Signal: The price manipulates lower, creates a Bearish FVG (Red Box), but then aggressively reverses and closes ABOVE that gap. The gap is now "Inverted" (turns Green), acting as support.
SELL Signal: The price manipulates higher, creates a Bullish FVG (Green Box), but then aggressively reverses and closes BELOW that gap. The gap is now "Inverted" (turns Orange), acting as resistance.
Key Features
Automated Pattern Recognition: No need to manually draw gaps. The script detects valid FVG inversions that align with the Judas Swing logic.
Built-in Risk Calculator: The signal labels display the exact Lot Size you should use based on your account balance and risk percentage (default 0.5%). It calculates this dynamically based on the Stop Loss distance.
Institutional Targets: The indicator fetches H1 Fractals (Liquidity) from the 1-hour timeframe and plots them on your 1-minute chart as blue lines. These are your primary Take Profit (TP) levels.
Stop Loss Visualization: Automatically suggests a Stop Loss placement behind the swing high/low of the reversal structure.
How to Use
Timeframe: Set your chart to 1 Minute (1m).
Asset: UK100 (FTSE 100).
Wait: Allow the London session to open. Watch for price to move away from the opening line.
Execute: When a BUY or SELL label appears:
Enter the trade using the Lot Size shown on the label.
Set your Stop Loss at the price shown on the label.
Target the blue H1 Liquidity lines for profit taking.
Settings
Timezone: Set this to your chart/exchange timezone (Default: Europe/Warsaw).
Account Balance: Input your current trading capital (e.g., 100,000) for accurate risk calculations.
Risk Per Trade %: The percentage of your account you are willing to lose if the Stop Loss is hit (Standard: 0.5% - 1.0%).
Contract Size: The value of 1 point movement (Check your broker's specifications. Usually 1 for CFDs).
Alerts You can set a single alert in TradingView to capture all signals. Select the indicator and choose "Any alert() function call". You will receive a notification with the direction (Buy/Sell), Entry Price, and Lot Size.

Early Momentum Dashboard [Small Caps]Early Momentum Dashboard for Small Caps
A clean, real-time dashboard that detects building momentum before major moves in small-cap stocks.
Features:
• 7 key early-momentum indicators with traffic-light system (🟢 Bullish / 🟡 Neutral / 🔴 Bearish)
• Toggle each indicator on/off via settings
• Momentum Score (e.g., 5/7) – higher = stronger early signal
• Visual markers on chart (VOL, RSI, MACD)
• Includes: Relative Volume Spike, RSI Buildup, MACD, OBV Accumulation, ROC, ATR Volatility, VWAP Proximity
Ideal for scanning low-float or catalyst-driven small caps.
Tip: Look for 4+ green lights as a high-probability early entry signal.
Enjoy!

Precision Candle (Multi-Asset)This Script Helps in finding a Precision Candle, which signifies a potential crack in correlated assets.
you can choose between 2 or 3 assets.
make sure to use the same time frame across all assets.
Enjoy !

Magical Thirteen Turns - The Greedy SnakeThe number 9 appears:
Meaning: Warning signal. The rise may encounter resistance and a cautious pullback is about to begin.
Operation: Consider reducing your holdings (selling a portion) to lock in profits and avoid experiencing wild fluctuations.
The number 13 appears:
Meaning: Strong sell signal. The upward momentum is likely to be exhausted, which is also known as "bull exhaustion".
Operation: It is recommended to liquidate your positions or significantly reduce them. Short sell (if you are trading contracts).

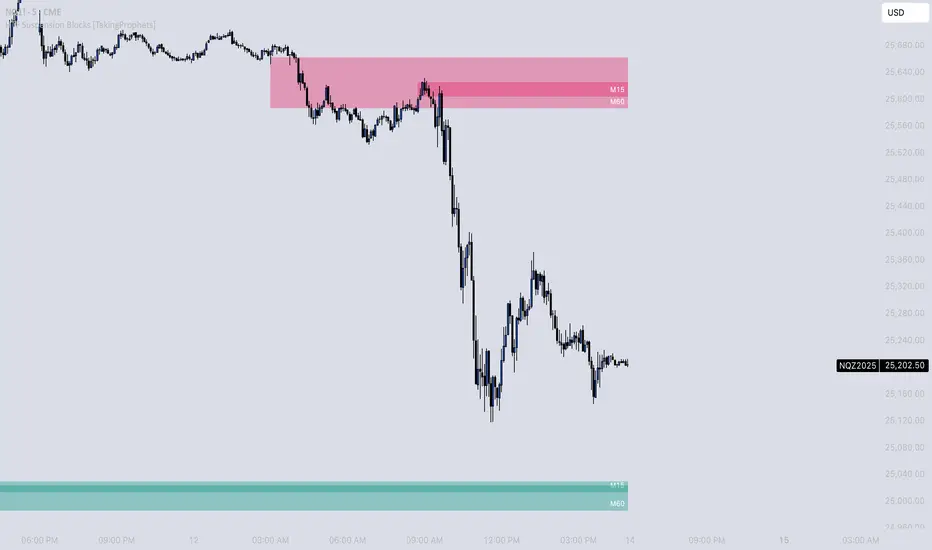
HTF Suspension Blocks [TakingProphets]-----------------------------------------------------------------------------------------------
HTF SUSPENSION BLOCKS
-----------------------------------------------------------------------------------------------
HTF Suspension Blocks bring ICT’s Suspension Block concept into a multi-timeframe workflow by detecting the 3-candle pattern on higher timeframes and projecting those zones directly onto your current execution chart.
Instead of only seeing Suspension Blocks on the timeframe they form, this script identifies valid HTF formations, draws their ranges on your lower timeframe, extends them forward, and manages invalidation automatically. You get higher-timeframe context while staying in your execution environment.
-----------------------------------------------------------------------------------------------
PURPOSE AND SCOPE
-----------------------------------------------------------------------------------------------
- Detect ICT-style Suspension Blocks on multiple higher timeframes (HTF 1 / HTF 2 / HTF 3)
- Project HTF blocks onto the current chart using bar-time anchored drawing
- Require measurable body-to-body separation defined in true ticks (instrument-aware)
- Auto-extend blocks forward in time until invalidation
- Optional Consequent Encroachment (50% equilibrium) inside each block
- Per-timeframe visibility limiting so charts stay clean and actionable
- Labels each block with the originating HTF (ex: M5 / M15 / M60)
- Alerts for:
- New HTF bullish / bearish block formation
- Price entering into any HTF bullish / bearish block
- Session-restricted alert windows (New York time)
-----------------------------------------------------------------------------------------------
WHAT IS A SUSPENSION BLOCK
-----------------------------------------------------------------------------------------------
A Suspension Block is a strict 3-candle displacement sequence defined by body-to-body gaps around a middle candle. This HTF variant uses the same model, but evaluates the pattern on a higher timeframe and then projects the zone onto your current chart.
Bullish Suspension Block logic:
- HTF Candle 1 close is BELOW HTF Candle 2 open by at least Minimum Body Separation
- HTF Candle 3 open is ABOVE HTF Candle 2 close by at least Minimum Body Separation
- HTF Candle 3 open is ABOVE HTF Candle 1 close to ensure a valid vertical span
- Block vertical span: Candle 1 close (low) to Candle 3 open (high)
- Block remains valid until price CLOSES below the block low (Candle 1 close)
Bearish Suspension Block logic (mirror conditions):
- HTF Candle 1 close is ABOVE HTF Candle 2 open by at least Minimum Body Separation
- HTF Candle 3 open is BELOW HTF Candle 2 close by at least Minimum Body Separation
- HTF Candle 3 open is BELOW HTF Candle 1 close to ensure a valid vertical span
- Block vertical span: Candle 1 close (high) to Candle 3 open (low)
- Block remains valid until price CLOSES above the block high (Candle 1 close)
All gap calculations are normalized using `syminfo.mintick` so the “ticks” setting behaves correctly across instruments.
-----------------------------------------------------------------------------------------------
GENERAL SETTINGS
-----------------------------------------------------------------------------------------------
- Minimum Body Separation (ticks)
- Minimum required body-to-body gap in HTF tick units
- Used for both:
- Candle 1 close to Candle 2 open separation
- Candle 2 close to Candle 3 open separation
- Examples:
- 0.25 = quarter-tick gap
- 1.0 = full tick gap
-----------------------------------------------------------------------------------------------
TIMEFRAMES
-----------------------------------------------------------------------------------------------
This script supports up to 3 higher timeframe sources. Each HTF has:
- Enable toggle
- Timeframe selector
- Per-timeframe Max Blocks visibility control
HTF 1 / HTF 2 / HTF 3:
- These are the timeframes the script scans for Suspension Blocks
- Blocks are drawn only when your current chart timeframe is LOWER than the selected HTF
- This prevents duplicate / redundant rendering when you’re already on the HTF or higher
Max Blocks per timeframe:
- Limits the number of most-recent blocks shown per side (bullish + bearish) for that HTF
- 0 = show all blocks for that timeframe
-----------------------------------------------------------------------------------------------
VISUALIZATION SETTINGS
-----------------------------------------------------------------------------------------------
Bullish Blocks:
- Toggle visibility
- Fill color controls opacity / emphasis
- Optional border with selectable style (Solid / Dashed / Dotted)
Bearish Blocks:
- Toggle visibility
- Fill color controls opacity / emphasis
- Optional border with selectable style (Solid / Dashed / Dotted)
Consequent Encroachment (CE):
- Optional 50% equilibrium line drawn inside each block
- Style options (Solid / Dashed / Dotted)
- Automatically extends as blocks extend
HTF Labels:
- Each block is labeled with its originating timeframe (ex: M5 / M15 / M60)
- Label styling includes:
- Text color
- Size (Tiny / Small / Normal / Large)
- Labels are intentionally hidden on non-visible blocks when visibility limiting is active
-----------------------------------------------------------------------------------------------
HOW HTF PROJECTION WORKS
-----------------------------------------------------------------------------------------------
- The script requests the last 3 candles of each selected HTF via `request.security()`
- It maps those HTF candles into the standard 3-candle Suspension Block model:
- Candle 1 = oldest
- Candle 2 = middle
- Candle 3 = most recent
- When a valid block forms:
- A box is created using `xloc.bar_time`
- The left side anchors to the HTF candle timestamp
- The right side projects forward to the current chart time
- Each HTF has its own independent storage set:
- Bull boxes, bear boxes
- High / low bounds
- CE lines
- Labels
-----------------------------------------------------------------------------------------------
BLOCK MANAGEMENT & INVALIDATION
-----------------------------------------------------------------------------------------------
- All blocks extend forward automatically to the current bar time
- Bullish invalidation:
- Block is removed when price CLOSES below the block low
- Bearish invalidation:
- Block is removed when price CLOSES above the block high
- When a block invalidates:
- The box is deleted
- Its CE line is deleted
- All stored references are removed from the set
This keeps the chart focused on active HTF zones only.
-----------------------------------------------------------------------------------------------
VISIBILITY LIMITING
-----------------------------------------------------------------------------------------------
Each timeframe’s “Max Blocks” setting controls how many blocks per side remain visible.
When Max Blocks > 0:
- The script calculates distance from current price to every stored block range
- It keeps the closest N blocks per side (bullish + bearish)
- Blocks not kept are made fully transparent:
- Hidden fill
- Hidden border
- Hidden CE line
- Hidden label text
This gives you the most relevant HTF structures near price without clutter.
-----------------------------------------------------------------------------------------------
ALERT SYSTEM
-----------------------------------------------------------------------------------------------
Alerts are optional and can be restricted to specific NY sessions.
Sessions (New York time):
- Session 1 (default: 09:30–16:00)
- Session 2 (optional)
- Session 3 (optional)
Alert types:
- HTF Bullish Block Formed
- Triggers when any enabled HTF forms a new bullish suspension block
- HTF Bearish Block Formed
- Triggers when any enabled HTF forms a new bearish suspension block
- Enter Bullish Block
- Triggers when price transitions from NOT inside any bullish HTF block to inside one
- Enter Bearish Block
- Triggers when price transitions from NOT inside any bearish HTF block to inside one
Messages:
- Fully customizable alert text inputs
- Script automatically appends ticker + current chart timeframe for context
-----------------------------------------------------------------------------------------------
BEST USE CASES
-----------------------------------------------------------------------------------------------
- Use HTF Suspension Blocks as “context zones” while executing on a lower timeframe
- Pair with ICT displacement, liquidity, PD arrays, and market structure for confluence
- Treat blocks as HTF inefficiency zones that can act as reaction points on retracements
- Use “enter block” alerts as a heads-up to shift into execution mode at HTF levels
-----------------------------------------------------------------------------------------------
DISCLAIMER
-----------------------------------------------------------------------------------------------
This indicator is provided for educational and analytical purposes only. It does not constitute financial advice. Trading involves risk, and past performance is not indicative of future results.
© TakingProphets
-----------------------------------------------------------------------------------------------
MWTI Introduction onChartMarket Wave TransIndex (MWTI)
Colors show when to attack and when to rest.
• Background = current market wave
• Masked zones = low momentum (rest)
• Upper dots = higher timeframe bias
No symbols, no predictions.
Just read the market state.
Works on any market, any timeframe.
Introduction (sample) is optimized for the 15m chart.
Try it on any market in 15m.
-------------------------------------------------------
