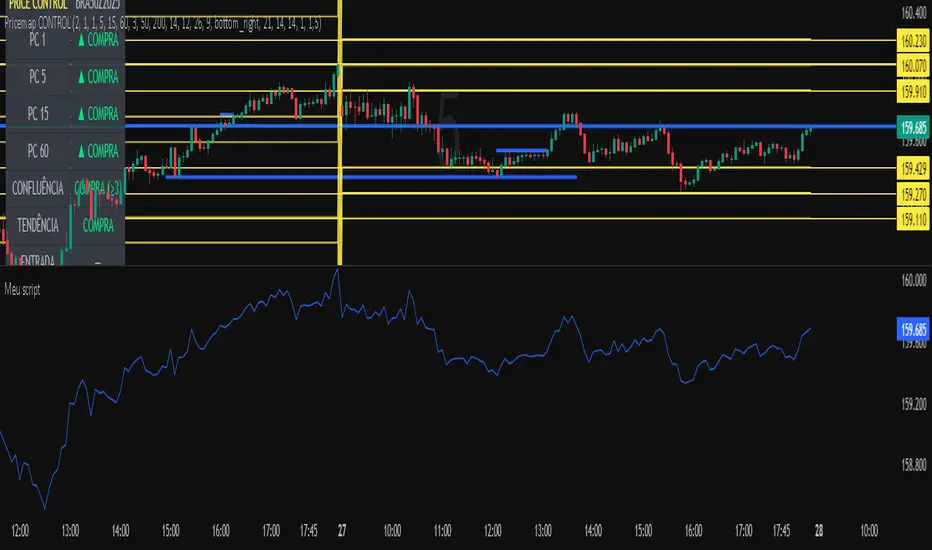
Meu scriptPricemap CONTROL (2, 1, 1, 5, 15, 60, 3, 50, 200, 14, 12, 26, 9, bottom_right, 21, 14, 14, 1, 1,5)
Candlestick analysis
Championship Scalper [Trend & Trap]Championship Scalper
Overview This is a high-precision scalping indicator designed to capture Liquidity Traps (Swing Failure Patterns). It waits for price to "sweep" a key level (grabbing stop losses) and immediately reverse, signaling that smart money has entered the market.
How it Works (The "Confluence" Engine) A signal is only generated when four specific conditions align perfectly:
The Trap: Price must sweep a Swing High or Low and close back inside the range (rejection).
The Trend: Trades are only taken in the direction of the dominant trend (using a 200 EMA).
Price > EMA = Longs only.
Price < EMA = Shorts only.
The Momentum (RSI): Prevents buying tops or selling bottoms.
Longs: RSI must be trending UP and sitting in the bullish zone (30-60).
Shorts: RSI must be trending DOWN and sitting in the bearish zone (60-30).
The Confirmation (CVD): Verifies the move with Order Flow (Cumulative Volume Delta) to ensure hidden volume supports the reversal.
Visual Signals
Green Triangle (▲): Bullish Signal. Validated dip-buy opportunity.
Red Triangle (▼): Bearish Signal. Validated short-sell opportunity.
Dashboard A mini-panel in the bottom right displays the current Trend Status (Bullish/Bearish) and the exact price levels of the most recent active Swing Highs and Lows.

Micha Stokes Buyers Breakout Alert v2I added comments starts with EE , where code modifications are needed

i don want to tell you how to use
"Regarding the specific inquiry into the precise manner and method by which one might go about employing the features present herein, I have decided, after much deliberation and careful consideration of all variable factors, to abstain from delivering a prescriptive lecture, thereby allowing the operational paradigm to remain an open-ended question for you to resolve."

Heikin Ashi Croce - MinimalHeikin Ashi Doji Marker – Minimal Version (Numeric Parameters)
This indicator identifies potential Heikin Ashi doji candles and marks them with a small triangle above the candle.
Numeric criteria used to detect a doji:
Body size: up to 60% of the total candle range
Upper wick: at least 15% of the total candle range
Lower wick: at least 15% of the total candle range
Wick balance: the ratio of upper wick to lower wick between 0.5 and 2
Purpose:
The indicator highlights visually evident doji candles while leaving the final decision to the trader’s discretion. It is non-restrictive, allowing traders to filter signals based on context, trend, and pullbacks.


Big Tech Sniper [TSLA/AAPL/MSFT/META]Precision Engineered for the "Magnificent" Stocks.
The Big Tech Sniper is a specialized version of our institutional logic, tuned specifically for the unique volatility profiles of Tesla, Apple, Microsoft, and Meta.
Unlike generic indicators, this script includes an Asset Validator that confirms you are trading an optimized ticker. If you try to use this on a low-quality penny stock, the system will warn you: "UNSUPPORTED ⚠️".
🚀 Optimized For:
TSLA (Tesla): Captures high-beta explosive moves.
AAPL (Apple): Tuned for steady, high-volume trends.
MSFT (Microsoft) & META: Calibrated for institutional order flow.
🔥 Institutional Features:
VWAP Anchor: Only trades in the direction of bank accumulation.
Volume Gate: Filters out "Lunchtime" fakeouts (Low Volume = No Trade).
Blue Zone Targeting: Automatically detects when the Profit Target is hit to prevent FOMO.
🔒 HOW TO UNLOCK: This is an Invite-Only tool for members of Scaler Pro Systems. Get your license here: whop.com
(Enter your TradingView username at checkout for instant access)

SuperTrend Zone Rejection [STRZ] CONCEPT -
This indicator identifies trend-continuation setups by combining the Super Trend with dynamic Average True Range (ATR) value zones. It highlights specific price action behaviour's—specifically wick rejections and momentum closes—that occur during pullbacks into the trend baseline.
HOW IT WORKS -
The script operates on three logic gates:
>> Trend Filter: Uses a standard Super Trend (Factor 3, Period 10 default) to define market direction.
>> Dynamic Zones: Projects a volatility-based zone (default 2.0x ATR) above or below the Super Trend line to define a valid pullback area.
>> Signal Detection: Identifies specific candle geometries occurring within these zones.
>> Rejection: Candles with significant wicks testing the zone support/resistance.
>> Momentum: Candles that open within the zone and close in the upper/lower quartile of their range.
FEATURES -
>> Dynamic Channel: Visualizes the active buy/sell zone using a continuous, non-repainting box.
>> Volatile Filtering: Filters out low-volatility candles (doji's/noise) based on minimum ATR size.
>> Visuals: Color-coded trend visualization with distinct signal markers for qualified entries.
SETTINGS -
>> Super Trend: Adjustable Factor and ATR Period.
>> Zone Multiplier: Controls the width of the pullback zone relative to ATR.
>> Visuals: Customizable colours for zones and signals to fit light/dark themes.

Highlight Running 30m CandleThis script highlight 30 minute running candle.
mostly used for crypto trading

KuberakshKuberaksh is a dynamic, trend-following indicator designed to identify market direction and potential reversals with high clarity. Built on the core logic of the HalfTrend, this script provides traders with clean, actionable signals and visual confirmation of channel deviation.
🔑 Key Features & Logic
Adaptive Trend Detection: The indicator calculates the main trend line (ht) by tracking the price using an Average True Range (ATR) and combining it with Exponential Moving Average (EMA) principles applied to the highest and lowest prices.
Deviation Ribbons: It plots dynamic ATR High and ATR Low ribbons around the HalfTrend line, colored green (buy) or red (sell), which visually represent the current market volatility and channel extremes.
Reversal Signals: Clear Buy and Sell signals are generated when the price breaks the prior trend channel and the internal high/low tracking confirms a switch in direction. These signals are marked by arrows and optional labels.

Karapuz Daily Context EngineKarapuz Daily Context Engine is designed for traders who want to understand the day’s context in advance and see how the market shapes its structure even before European liquidity hits the chart. It blends Asian session analysis with fractal structure, helping you quickly grasp the market’s intraday dynamics and potential directional bias.
The indicator automatically highlights the Asian session, reads its range, and compares it to the previous one. Based on this comparison, it generates a color-coded state — a daily sentiment marker that instantly shows whether buyers or sellers are taking the initiative.
The Asia box fills with color one hour before the Frankfurt open, giving you early access to the emerging context and making this tool perfect for your morning preparation.
Fractals act as clean structural cues, helping you identify key local highs and lows without cluttering the chart.
Key Features:
Intelligent detection and analysis of the Asian session.
Color-based daily context generated by comparing the current and previous Asian ranges.
True daily context that refreshes every new trading day.
Early visualization — session shading appears 1 hour before Frankfurt opens.
Adjustable fractals (3/5 bars) for clean structural insights.
Minimalistic, sharp visual design optimized for fast chart reading.
For contact or questions, you can reach me on Telegram: @KarapuzGG

TheStrat Failed 2 + 2 Continuation FTFC AlignmentTheStrat “Failed 2 + FTFC Alignment” spots a specific reversal/continuation pattern and layers on higher-timeframe confirmation so newer traders can focus on clean, high-probability setups.
WHAT IT LOOKS FOR
- A Failed 2 bar (price breaks the prior high/low but closes back through its open).
• Failed 2D (bullish): price takes out the previous low but finishes green.
• Failed 2U (bearish): price takes out the previous high but finishes red.
- The very next bar must be a true “2” continuation in the opposite direction (2U after a Failed 2D or 2D after a Failed 2U). This is the classic “2-2 reversal/continuation” from TheStrat playbook.
WHY IT MATTERS
When a failed 2 immediately resolves into a clean 2, it signals that buyers or sellers have seized control. These moves often become momentum pushes, especially if the broader timeframes agree.
HIGHER-TIMEFRAME FILTER
- Checks Monthly, Weekly, and 3-Day opens in real time.
- Bull signals only pass when all three are above their opens (full timeframe continuity up).
- Bear signals only pass when all three are below their opens (full timeframe continuity down).
WHAT YOU GET
- Optional labels that mark Failed 2 bars and the confirmed 2-2 signals.
- A compact “FTFC” icon on the exact bar where the continuation qualifies.
- Toggleable intrabar and bar-close alerts (select “Any alert() function call” for real-time alerts).
- A mini panel showing Monthly/Weekly/3-Day arrows so you can verify FTFC at a glance.
- Settings to require the continuation candle to be the same color as the failed bar for extra confirmation.
HOW TO USE
1. Add the script to your chart and confirm the panel arrows are aligned when icons appear.
2. Turn on the bar-close alert conditions for confirmed signals, or enable intrabar alerts for early warnings.
3. Combine the signal with your entry/stop rules (e.g., trigger on break of the signal bar and use the prior swing for risk).
This script serves as training wheels for traders learning TheStrat by automatically filtering for high-quality Failed-2 → 2 reversals that align across multiple timeframes.

多周期MA/EMA指标 [MA/EMA 20, 60, 120]This Pine Script plots the 20-period, 60-period, and 120-period Moving Averages (MA) and Exponential Moving Averages (EMA) on the chart. It helps identify short-term, medium-term, and long-term trends by showing how price interacts with different timeframes of moving averages. The script assists in analyzing trend reversals and smoothing price data to make informed trading decisions.

Morning Box [Fax Academy]Morning Box — Precision Daily Bias Box for Professional Traders
Overview
Draws a daily box from a single 1-hour candle (default: 11:00 PM UTC) and extends it forward into the trading day.
Fully timezone-aware (Exchange or specific region). Box levels are locked after the hour closes — no repainting .
Clean, stable, and designed for consistency in all global markets.
What It Does
Selects exactly one 1-hour bar per day using a configurable 12h + AM/PM time input.
Plots a high–low box around that candle.
Provides flexible extension options:
Candle Only — limits box to the 1-hour range.
End of Day (TZ) — extends the box to the end of the selected timezone’s trading day.
Extend N Hours — customizable width for strategy-specific use.
Maintains only the current day's box; previous day’s box is automatically replaced.
Inputs
Timezone : UTC, Exchange, or region (Asia/Dhaka, Europe/London, America/New_York, etc.).
Target Hour (12h) + AM/PM : defines which 1-hour candle is used.
Extend Right : Candle Only, End of Day (TZ), or Extend N Hours.
Extend N Hours : number of hours if using the custom extension mode.
Box Styling : Color, transparency, border width.
How To Use
Works on any chart timeframe — the selected candle is always a true 1-hour bar in the chosen timezone.
Choose a meaningful Target Hour (e.g., NY close, Asia open).
Select extension style:
End of Day (TZ) → ideal for full-session framing
Extend N Hours → flexible for any strategy (e.g., Asia range, pre-London box)
Candle Only → minimal, high-precision range focus
Use the resulting box as a daily bias tool, liquidity pocket, or session anchor.
Best Practices
Align your Target Hour with key market transitions (NY close → Asia open for Forex/Gold).
Pair with:
EMA — for directional bias and structural confidence.
Sessions — for timing and volatility context.
Keep the “only today’s box” design for uncluttered daily workflow.
Defaults
Timezone: UTC
Target Hour: 11 PM
Extend Right: End of Day (TZ)
Colors: Fax Academy standard theme (fully editable)
Notes
Non-repainting — box values lock after the selected candle closes.
Works on all chart timeframes; vertical bounds always represent that day’s chosen 1-hour high/low.
Brand
Crafted by Fax Academy for traders who value simplicity, precision, and consistency.
Educational use only — not financial advice. Always validate concepts through backtesting and risk-managed execution.

Stat Map Pro: Z-Score + RSI + Vol + Div StatMap Ultimate is a multi‑factor statistical mapping tool designed to give traders a deeper view of market extremes, momentum, and hidden divergences. By combining Z‑Score analysis, RSI momentum signals, volume spikes, and divergence detection, this indicator helps you spot high‑probability turning points and confluence setups with clarity.
🔑 Key Features
- Z‑Score Candles: Price is normalized against its statistical mean, showing how far OHLC values deviate from equilibrium. This makes overbought/oversold zones (+2σ / ‑2σ) visually clear.
- RSI Integration: Candle coloring adapts to RSI momentum, highlighting bullish/ bearish bias and extreme conditions (OB/OS).
- Volume Spike Detection: Borders and wicks turn gold when volume exceeds a customizable threshold, signaling strong participation.
- Divergence Mapping: Automatic detection of bullish and bearish divergences between price and Z‑Score pivots, plotted directly on the chart.
- Confluence Signals: Simple circle markers highlight extreme setups where Z‑Score and RSI align, helping traders identify potential reversals.
🎯 How to Use
- Watch for Z‑Score extremes (+2σ / ‑2σ) combined with RSI OB/OS for potential turning points.
- Use gold volume spikes to confirm strong market interest.
- Pay attention to divergence labels (Bull Div / Bear Div) for early reversal clues.
- Combine signals for high‑confidence entries/exits in your trading strategy.
⚡ Why It’s Powerful
Stat Map Pro transforms raw price, momentum, and volume data into a unified statistical framework. Instead of relying on a single indicator, you get a multi‑layered confluence map that highlights when markets are stretched, exhausted, or primed for reversal.

User Predefined Lines / IntervalsThis script, marks some of the values/intervals used in trading.
The following features are drawn:
Previous high and low
Asia high and low
London high and low
Opening prices at 00:00 and 08:30
Price range for 03:00 (03:00-3:59)
For each group you can set:
The number of the last days drawn on the chart
The length of the lines, in hours per group
The name and range of time for each group as needed
Please note the script uses the timezone set in the TradingView
The script uses the values from TradingView. So in 1D time interval, you wouldn't be able to see those hourly indicators.
If the indicator appears with the list of inputs on your chart legend, you can disable it in indicator-setting-style- disable show inputs

RSI Price Action Hunter [AlgoSystem]A combined indicator designed to identify precise trend reversal points. The algorithm filters RSI overbought and oversold signals by confirming them with powerful candlestick patterns (Bullish and Bearish Engulfing).
How it works: The indicator solves the main issue with RSI—false counter-trend signals. An entry signal is generated only when two conditions are met simultaneously:
RSI hits extreme zones: The price is in the overbought (default >70) or oversold (<30) zone.
Candlestick Confirmation: An "Engulfing" pattern forms, indicating a genuine shift in market sentiment.
Key Features:
Buy/Sell Signals: Clear labels on the chart when conditions align.
Zone Visualization: Background highlighting (Green/Red) at the moment of the signal for better visibility.
Flexible Settings: Adjustable RSI period, Overbought/Oversold levels, and pattern filters.
Alerts: Built-in alert system for App or Email notifications.
Settings:
RSI Length: RSI indicator period (default is 7 for faster reaction).
Overbought/Oversold: Boundary levels (70/30).
Patterns: Enable/Disable Engulfing filter.
Exit Zone: Visual hint for the estimated exit zone (in %).
Usage Strategy: Use this tool for Swing Trading reversals or to find pullbacks within a global trend. It works best on timeframes from 15m to 4h.

J&A Sessions & NewsProject J&A: Session Ranges is a precision-engineered tool designed for professional traders who operate based on Time & Price. Unlike standard session indicators that clutter the chart with background colors, this tool focuses on Dynamic Price Ranges to help you visualize the Highs, Lows, and liquidity pools of each session.
It is pre-configured for Frankfurt Time (Europe/Berlin) but is fully customizable for any global location.
Key Features
1. Dynamic Session Ranges (The Boxes) Instead of vertical stripes, this indicator draws Boxes that encapsulate the entire price action of a session.
Real-Time Tracking: The box automatically expands to capture the Highest High and Lowest Low of the current session.
Visual Clarity: Instantly see the trading range of Asia, London, and New York to identify breakouts or range-bound conditions.
2. The "Lunch Break" Logic (Unique Feature) Institutional volume often dies down during lunch hours. This indicator allows you to Split the Session to account for these breaks.
Enabled: The script draws two separate boxes (Morning Session vs. Afternoon Session), allowing you to see fresh ranges after the lunch accumulation.
Disabled: The script draws one continuous box for the full session.
3. Manual High-Impact News Scheduler Never get caught on the wrong side of a spike. Since TradingView scripts cannot access live calendars, this tool includes a Manual Scheduler for risk management.
Input: Simply input the time of high-impact events (e.g., CPI, NFP) from ForexFactory into the settings.
Visual: A dashed line appears on the chart at the exact news time.
Audio Alert: The system triggers an alarm 10 minutes before the event, giving you time to manage positions or exit trades.
Default Configuration (Frankfurt Time)
Asian Session: 01:00 - 10:00 (Lunch disabled)
London Session: 09:00 - 17:30 (Lunch: 12:00-13:00)
New York Session: 14:00 - 22:00 (Lunch: 18:00-19:00)
How to Use
Setup: Apply the indicator. The default timezone is Europe/Berlin. If you live elsewhere, simply change the "Your Timezone" setting to your local time (e.g., America/New_York), and the boxes will align automatically.
Daily Routine: Check the economic calendar in the morning. If there is a "Red Folder" event at 14:30, open the indicator settings and enter 14:30 into the News Scheduler.
Trade: Use the Session Highs and Lows as liquidity targets or breakout levels.
Settings & Customization
Timezone: Full support for major global trading hubs.
Colors: Customize the Box fill and Border colors for every session.
Labels: Rename sessions (e.g., "Tokyo" instead of "Asia") via the settings menu.

Fair Value Gaps [Fax Academy]FVG — Precision Fair Value Gap Detection for Professional Traders
Overview
Identifies and draws Fair Value Gaps (FVGs) using a refined 3-bar displacement model on the selected timeframe.
Optimized for Forex and Gold, but fully compatible with all instruments and timeframes.
Non-repainting, fast, and engineered to filter only meaningful imbalances.
ATR% or Points-based thresholds ensure cleaner charts; optional “latest only” mode and automatic gap removal on fill.
Detection Logic
Bullish FVG :
Current low > high from two bars ago, and the prior bar closes above that high at a source-timeframe boundary.
Bearish FVG :
Current high < low from two bars ago, and the prior bar closes below that low at a source-timeframe boundary.
All boxes anchor using xloc.bar_time for precise alignment with the source timeframe.
Inputs
Source Timeframe : Chart timeframe or any higher TF (1H, 4H, D, etc.)
Show Bullish / Show Bearish : Direction toggles.
Threshold Mode : Points or ATR % filter (dynamic). ATR length is internal; set your preferred percentage.
Min Gap (points) : Used when Threshold Mode = Points.
Extend Bars : How many bars the box extends to the right.
Show Latest Only : Only show the most recent gap.
Delete On Fill : Automatically remove gaps once price fully mitigates them.
Colors & Border Width : Fully adjustable styling.
How To Use
Select a Source Timeframe to map higher-TF FVGs onto lower-TF charts (e.g., 4H → 1H/15m).
Use ATR % filtering (10–20% recommended) to eliminate small, irrelevant gaps.
Enable “Latest Only” for a clean chart, or keep full history for multi-mitigation analysis.
Combine with:
EMA for trend + pullback structure.
Sessions for timing and volatility alignment.
Reading FVGs
Unmitigated FVGs can behave like magnets or supply/demand pockets.
In trending markets, fresh FVGs aligned with higher-TF bias offer high-quality continuation entries.
Filled gaps are automatically deleted when “Delete On Fill” is enabled.
Defaults
Bullish = ON, Bearish = ON
Threshold Mode: ATR % (10%)
Extend Bars: 1
Latest Only: OFF
Delete On Fill: ON
Colors: Dark Green (bullish), Dark Red (bearish)
Notes
Non-repainting — all detection occurs only when the source timeframe bar closes.
Works on any chart timeframe with perfect timestamp alignment.
If your chart lacks enough higher-TF bars, extend history or select a lower Source TF.
Brand
Developed by Fax Academy to bring precision, clarity, and professional-grade imbalance analysis to modern trading.
For educational and analytical purposes only — always combine with sound risk management and verification.

Yit's Risk CalculatorIntroducing a risk a bulletproof risk calculator.
I'm tired of sitting on my brokerage, messing with my shares to buy while price action leaves me in the dust.
For my breakout strategy execution is everything i dont have time to stop and think.
within the Indicator settings you have free reign to change account size and risk%
*the stop loss is glued to the low of the day*

BOS/CHoCH Market Structure with Order BlocksCHoCH • BOS • Market Structure Suite with Institutional Order Blocks (Pine Script v6)
This advanced market-structure indicator is designed for traders who rely on clean, rule-based price action. It automatically identifies structural shifts, confirms major trend transitions, and highlights institutional points of interest such as order blocks. Built with precision and clarity, the tool provides multi-layered insight without cluttering the chart.
Key Features
✔ Break of Structure (BOS) Detection
Detects bullish and bearish BOS with strict candle-close confirmation.
Draws colored lines:
Green BOS line when price closes above the previous high.
Red BOS line when price closes below the previous low.
BOS lines automatically label themselves for quick visual reference.
✔ Change of Character (CHoCH)
Identifies the earliest sign of a potential trend reversal.
Prints green CHoCH for bullish shifts and red CHoCH for bearish shifts.
Helps traders anticipate new market phases with precision.
✔ Swing Structure Labels (HH, HL, LH, LL)
Automatically marks all confirmed swing points:
HH, HL (green) for bullish structure
LH, LL (red) for bearish structure
Uses tiny, clean labels to keep the chart readable.
✔ Institutional Order Blocks (Bullish & Bearish)
Identifies valid order blocks using institutional logic.
Bullish Order Blocks: highlights the last bearish candle before bullish displacement.
Bearish Order Blocks: highlights the last bullish candle before bearish displacement.
Draws automatic extended boxes:
Red boxes for bullish order blocks
Blue boxes for bearish order blocks
Boxes extend to the right until mitigation occurs.
✔ Timeframe Filtering for Order Blocks
Order blocks only appear on higher timeframes (1H → Monthly), reducing noise.
Automatically hides order-block zones on lower timeframes.
✔ Fully Customizable Settings
Enable or disable BOS, CHoCH, swing labels, or order blocks.
Adjust colors, line width, font size, transparency, and extension options.
Set the number of order block boxes to keep on screen.
Clean user interface with intuitive controls.
✔ Built for Reliability
Uses defensive coding to prevent runtime errors.
Efficient pivot-handling, minimal label clutter, and safe object management.
Suitable for intraday, swing, and smart money concept traders.

Key Levels by Romulus V2This is the updated key levels script I added dynamic levels that change throughout the day opening range high and low and customizable settings to adjust.
