Optimal Trading ReplayOptimal Trading Replay
---------------------------------------------------------
This indicator helps you visualize your executed trades directly on the TradingView chart.
// Features:
// - Imports your trade list (CSV-style text input)
// - Plots entries, exits, and direction arrows
// - Draws P&L summary boxes on chart
// - Useful for replay, journaling, and verification
Candlestick analysis

CISD**CISD – Continuous Implied Structure Displacement (Body-Based Version)**
CISD displays structure levels derived from a simple sequence:
1. A valid pullback (based on body closes only)
2. Followed by a displacement (a body-based break in the opposite direction)
When these two conditions occur, the script prints a CISD level at the pullback’s reference price.
Each CISD level extends forward until price closes through it using body logic only.
---
### How this version works
**1. Pullback Detection (Body-Only)**
A pullback is recognized when a candle’s body meaningfully retraces the previous candle’s body.
Tiny candles are filtered out, reducing noise and improving level quality.
**2. CISD Formation**
After a valid pullback, if price breaks structure in the opposite direction using body highs/lows only:
- A **Bullish CISD** level is created from a bearish pullback
- A **Bearish CISD** level is created from a bullish pullback
**3. CISD Completion**
When a CISD level is violated by a full body close beyond the level, the CISD is marked completed and a new opposite CISD becomes eligible.
**4. Visual Output**
- Clean horizontal CISD levels
- Single active level per direction (unless extended manually)
- Labels marked “CISD” for clarity
---
### What this indicator is *not*
This tool does **not** generate trade signals or provide financial advice.
It is a visual mechanism for observing how price reacts to pullback-based structural shifts using body logic only.
---
### Intended Use
CISD can help users:
- Track transitions in short-term structure
- Identify when pullbacks lead to meaningful displacement
- Observe reaction points derived strictly from body behavior (ignoring wicks)
The logic is minimalistic and designed for clean, uncluttered structure observation.


5min ORB - HenryJ5min ORB, for ICT trading
Strategy Implementation: The main goal is to identify and visually mark the trading range established during the first 5 minutes of the regular trading session.
Time Definition: It measures the Highest High and Lowest Low recorded from the session open (minute 0) up to the close of the 5th minute.
Visual Marking: It draws two distinct horizontal line segments on the chart:
One line marks the High of the 5-minute Opening Range.
One line marks the Low of the 5-minute Opening Range.
Drawing Window: The lines are intentionally drawn starting from the 6th minute (after the range is fully established) and extend up to the 60th minute of the trading session. This ensures the lines are available to guide trades for the first hour after the opening volatility subsides.
Labeling: It includes a "5min ORB" text label placed near the high line, clearly identifying the range.
BY Henry J


Ind-Suite: The Ultimate Strategic Dashboard [Gap/Dow/MA/SR]概要 Ind-Suiteは、トレードに必要な4つの重要な要素(窓、市場構造、移動平均線、水平線)を1つのインジケーターに統合した包括的なトレーディング・スイートです。 このツールの目的は、単一のサインに頼るのではなく、複数の根拠が重なる「コンフルエンス(Confluence)」を視覚的に発見することにあります。
機能モジュール 設定画面の「⚡ MODULE TOGGLES ⚡」から、各モジュールのON/OFFを瞬時に切り替えられます。
Module A: Gaps (窓)
未埋めの窓(Gap)をボックスで表示します。
価格が引き寄せられるターゲットとして機能します。一定期間経過した窓は自動的に非表示になります。
Module B: Dow Structure (ダウ理論と構造)
ZigZagラインによる波の描画と、トレンド状態の判定。
BOS (Break of Structure): トレンド継続のブレイクポイントにラベルを表示。
下落トレンド時は背景色が変化し、視覚的にトレンドを把握できます。
Module C: Safe Scaffold (足場と勢い)
EMA (9/20) & VWAP: トレンドフォローのための主要な移動平均線。
Bollinger Bands: ボラティリティの確認用(ON/OFF可能)。
Signal: EMAクロスとバンド幅拡大(スクイーズからのエクスパンション)を検知したロングサインを表示。
Module D: S/R Guardian (水平線)
過去のPivot点をベースに、意識されやすいサポート・レジスタンスラインを自動描画します。
強度に基づいてラインが統合され、重要度が高い価格帯を可視化します。
推奨される使い方 すべてのモジュールを常にONにする必要はありません。チャートが情報過多にならないよう、必要な機能だけを選択して表示してください。 例えば、「S/Rライン」での反発、「Dow Structure」でのBOS、「Gap」の埋め完了など、3つ以上の根拠が重なるポイントは、優位性の高いエントリーポイントとなります。
--------------
Overview Ind-Suite is a comprehensive trading suite that integrates four essential elements (Gaps, Market Structure, Moving Averages, and Support/Resistance) into a single indicator. The goal of this tool is not to rely on a single signal, but to visually identify "Confluence" where multiple factors align.
Feature Modules You can instantly toggle each module ON/OFF via the "⚡ MODULE TOGGLES ⚡" in the settings.
Module A: Gaps
Highlights unclosed gaps with boxes.
These act as price magnets/targets. Old gaps are automatically hidden after a set period.
Module B: Dow Structure (Trend & Market Structure)
Draws ZigZag waves and determines trend status based on pivot points.
BOS (Break of Structure): Labels are displayed at key breakout points confirming trend continuation.
Background color changes during downtrends for instant visual recognition.
Module C: Safe Scaffold (Momentum & MAs)
EMA (9/20) & VWAP: Key moving averages for trend following.
Bollinger Bands: For volatility analysis (Toggle available).
Signal: Displays Long signals upon EMA crossover combined with BBW expansion (volatility breakout).
Module D: S/R Guardian (Support & Resistance)
Automatically draws S/R zones based on historical pivot points.
Levels are merged based on proximity, visualizing significant price zones.
Recommended Usage It is not necessary to keep all modules ON at all times. Toggle features as needed to keep your chart clean. High-probability setups are often found where multiple factors converge (Confluence). For example: A bounce off an "S/R Line," confirmed by a "BOS" in Dow Structure, coinciding with a "Gap" fill.


BigCandleAndRSIAlertChanges Candle Color to your choosing for Big Candles or Big Wick Candles or Over Bought/Oversold RSI Levels.

The Trader's Edge (A professional Trader's tool)This is a script which is made by a professional stock trader and this script is capable of drawing Demand / Supply zones as well as capable of scoring the trade as well depending upon freshness, time spent in the zone, it also has the power to calculate the pre - defined risk to reward for every trade that you take as per this indicator. This script also displays the Trendo f the stock on 3 difrerent time frames on one single time frame easy to do multiple time frame analysis. and it also as the power of identifying which zones are falling outside "THE BOLLINGER BANDS" There by signaling an "ALL STAR ENTRY" This tool is A must have for any professional Stock trader.

SSS-version01SSS(standard serialize system)
This indicator is designed to analyze market fluctuations and automatically mark the local highs and lows of each wave.
By tracking these key "twisting" points, the indicator provides a clear structural view of price movements, allowing users to visualize how each wave evolves within the broader trend.
Through overviewing the distribution of tops and bottoms, users can quickly recognize the underlying market direction and structure.
(While the signals may appear with a slight delay — as the formation of each wave requires confirmation — they provide a more reliable reflection of the completed market movement)
This is the initial release of the complete SSS indicator, focused on basic wave recognition and labeling.
Future updates will continuously refine the detection algorithm and introduce additional structural features, enabling a deeper and more detailed deconstruction of market behavior.

⚔️ The Scalpel⚔️ THE SCALPEL v2.0
━━━━━━━━━━━━━━━━━━━━━━━━━━━━━━━━━━━━━━━━━━━━━━━━━━━━━━━━
Surgical-Grade Market Structure Detection System
🔬 WHAT IS THE SCALPEL?
The Scalpel is a precision-engineered market structure analyzer that identifies and tracks critical support and resistance zones with surgical accuracy. Unlike conventional S&R tools that flood your chart with noise, The Scalpel cuts through the clutter to reveal only the most significant price structures.
━━━━━━━━━━━━━━━━━━━━━━━━━━━━━━━━━━━━━━━━━━━━━━━━━━━━━━━━
⚙️ CORE TECHNOLOGY
▸ Pivot-Based Detection Engine
Advanced pivot analysis calibrated by user-defined precision settings
▸ Tissue Integrity Validation
Filters structures based on candle body-to-range ratios
▸ Dynamic Stress Analysis
Tracks zone interactions and removes exhausted levels automatically
▸ Volatility-Adaptive Zones
Zone width scales with ATR for consistent performance across all markets
━━━━━━━━━━━━━━━━━━━━━━━━━━━━━━━━━━━━━━━━━━━━━━━━━━━━━━━━
🎨 VISUAL SPECTRUM
💜 STERILE ZONES (Electric Violet)
Fresh, untested structures with maximum potential
🔴 COMPRESSION ZONES (Magenta Fire)
Tested resistance ceilings under selling pressure
🩵 FOUNDATION ZONES (Neon Teal)
Tested support floors with proven buyer interest
✨ PLASMA AURA EFFECT
Multi-layered glow effect for enhanced visibility
━━━━━━━━━━━━━━━━━━━━━━━━━━━━━━━━━━━━━━━━━━━━━━━━━━━━━━━━
📐 PARAMETERS
🔪 Blade Precision (1-10)
Higher = fewer but sharper pivots detected
🩺 Tissue Integrity % (30-90)
Minimum candle body percentage required
📏 Incision Depth (0.1-2.0 ATR)
Controls zone thickness based on volatility
💉 Stress Threshold (1-10)
Maximum touches before zone invalidation
📐 Projection Range (10-200)
How far zones extend into the future
━━━━━━━━━━━━━━━━━━━━━━━━━━━━━━━━━━━━━━━━━━━━━━━━━━━━━━━━
💡 HOW TO USE
1. Fresh sterile zones (violet) are your highest-probability setups
2. Watch for price reaction at zone boundaries
3. Tested zones confirm structure but may have diminished strength
4. Zones auto-remove after stress threshold is reached
5. Use projection range to anticipate future tests
━━━━━━━━━━━━━━━━━━━━━━━━━━━━━━━━━━━━━━━━━━━━━━━━━━━━━━━━
🎯 BEST FOR
✓ Scalping & Day Trading
✓ Swing Trade Entries
✓ Stop Loss Placement
✓ Take Profit Targeting
✓ Multi-Timeframe Analysis
━━━━━━━━━━━━━━━━━━━━━━━━━━━━━━━━━━━━━━━━━━━━━━━━━━━━━━━━
⚠️ DISCLAIMER
This indicator is for educational purposes only. Always conduct your own analysis and use proper risk management. Past performance does not guarantee future results.
━━━━━━━━━━━━━━━━━━━━━━━━━━━━━━━━━━━━━━━━━━━━━━━━━━━━━━━━
🏷️ TAGS
support resistance zones SNR pivot points market structure scalping day trading swing trading price action order blocks smart money supply demand technical analysis

Ichimoku MTF HeatmapGreat for flying down you watchlist, getting an idea what time frame to go to. Enjoy!

Ichimoku Traffic Lights Go--no go flags for Ichimoku Cloud. For quick scanning thru your watchlist, and good for scanning through timeframes.

CANDLE_TIME_RDThis tool displays the time of each candle directly on the chart by placing a label below
the bar with an upward-pointing arrow for clear visual alignment. It helps traders quickly
identify the exact timestamp of any candle during fast intraday analysis or historical review.
OVERVIEW
The script extracts the hour and minute of each bar, formats the timestamp according to the
user’s preference, and prints it beneath the candle. This removes the need to rely on the
data window or crosshair for time inspection. It is ideal for ITI evaluation, timestamp
journaling, and precise replay study.
FEATURES
- Prints the time under each candle or every N-th candle using a simple step input.
- Supports both AM/PM and military time through a toggle input.
- Builds all hour and minute text manually to ensure consistent formatting.
- Uses label.style_label_up to draw an arrow pointing toward the candle.
- Positions labels with yloc.belowbar so they do not overlap price bars.
USE CASES
- Reviewing setups with ChatGPT where exact candle timing matters.
- Studying EMA touches, VWAP interactions, or momentum shifts that occur at specific times.
- Journaling entries and exits with precise timestamps.
- Quickly identifying candle times without zooming or opening data windows.
This script is designed for clarity and convenience, improving workflow for structured
intraday traders and replay analysts.

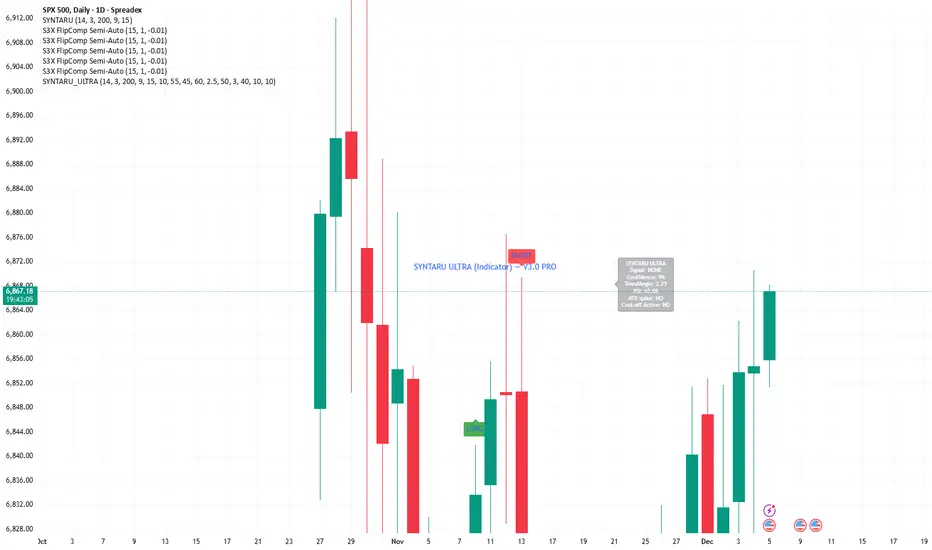
SYNTARU ULTRA (Indicator) — Non-Repaint PROSYNTARU ULTRA (Non-Repaint PRO)
A professional-grade, non-repainting trading indicator designed to identify high-probability entries using multi-layer analysis. Combines core trend EMA (G1), ATR-based volatility bands (G2), momentum (RSI + EMA slope, G3), and optional higher timeframe confirmation (G4) to generate LONG and SHORT signals. Features include ATR spike filters for news/noise avoidance, cool-off bars to reduce false alerts, confidence scoring (0–100%), and full webhook-ready alerts for automation. On-chart panel displays signal, confidence, trend angle, RSI, ATR spike status, and cool-off activity for real-time monitoring.
CapitalFlowsResearch: Sensitivity BandsCapitalFlowsResearch: Sensitivity Bands — Expected-Move Projection from Cross-Asset Beta
CapitalFlowsResearch: Sensitivity Bands builds on the idea of cross-asset sensitivity by turning beta into a set of projected price boundaries around the prior day’s close. Instead of showing beta as a standalone number, this tool translates it into real price levels that represent the expected magnitude of movement—up or down—given a typical shock in a chosen market driver.
The script measures how strongly the price asset has been responding to moves in the driver over a rolling window, then uses that relationship to calculate a dynamic “band width.” That width is applied symmetrically around the previous daily close to create two horizontal bands: an upper range and a lower range. These lines update intraday, offering a real-time sense of whether current price action is unfolding within normal sensitivity limits or pushing into statistically unusual territory.
Traders can choose how the driver’s changes are interpreted (basis points, absolute moves, or percent changes), and optionally replace the rolling band with a running mean to emphasise longer-term structural sensitivity. The resulting overlay acts much like an expected-move model—similar in spirit to options-derived ranges, but powered by beta dynamics rather than implied volatility.
In practice, Sensitivity Bands serves as a clean framework for contextualising market movement:
Inside the bands: price behaviour aligns with typical cross-asset sensitivity.
Touching a band: movement is strong but still consistent with historical response.
Breaking a band: indicates a regime shift, a driver disconnect, or unusually high momentum.
All of this is achieved without exposing the underlying beta calculations or normalisation logic.

CharisTrend Indicatorthis trading indicator uses the following parameters EMA LOW (25 34 89 110 355 and 480) SMA(14 and 28) and Supertrend(14 3) for trading analysis and BUY/SELL Signals when the trade aligns.

teril Harami Reversal Alerts BB Touch (Wick Filter Added) teril Harami Reversal Alerts BB Touch (Wick Filter Added)
teril Harami Reversal Alerts BB Touch (Wick Filter Added) teril Harami Reversal Alerts BB Touch (Wick Filter Added) teril Harami Reversal Alerts BB Touch (Wick Filter Added)
teril Harami Reversal Alerts BB Touch (Wick Filter Added)

Minor Break of Structure (Minor BoS)This indicator extracts and isolates the Minor Break of Structure (BoS) logic from a full SMC framework and presents it as a clean, lightweight tool for structure-based price action traders.
Unlike traditional BOS indicators that rely on swing calculations with heavy filtering, this script uses original SMC-style minor structure logic to detect meaningful shifts in internal order flow.
A Minor BoS appears when price breaks above a minor swing high (bullish) or below a minor swing low (bearish), confirming a short-term continuation in trend direction.
Features:
Bullish Minor BoS detection
Bearish Minor BoS detection
Automatic line plotting with extend-right
Clear “Minor BoS” label with tiny footprint
Customizable line styles and colors
Lightweight & optimized for fast execution
Zero repainting on BoS confirmations
This tool is ideal for traders who want a simple, clean, and reliable structure-based signal without the noise of major structure, order blocks, liquidity sweeps, or external SMC modules.

RTH Opening Range with ExtensionsTool that maps the opening range, opening range mid and extensions. Defaults are 5min OR with 1x extensions. You can customize to 1min, 5min, 15min or 30min opening ranges. Nothing complicated and certainly vibe coded with the help of Claude AI.

XAUUSD Liquidity Sweep + Engulfing (4H/2H/15m)Key Features in This Script:
4H Bias (Trend): We use RSI on 4H to determine if the market is in a bullish or bearish trend.
2H Setup: When price sweeps below previous lows or above previous highs (liquidity sweep), we confirm it with RSI and an engulfing candle.
15m Entry: After the liquidity sweep is confirmed on the 15m chart, we check for a bullish engulfing (for buys) or bearish engulfing (for sells) with RSI confirmation.
How to Use It:
Add the Script: Copy-paste the code above into TradingView’s Pine Editor.
Apply it to the 15-minute chart for XAUUSD (Gold).
Alerts: Set up alerts when a Buy or Sell signal appears based on the conditions.
Alerts Example:
When a liquidity sweep and RSI flip happens with an engulfing candle, TradingView will notify you, helping you enter at the right time.
🚀 Next Steps:
Try it out and let me know how the alerts and signals are working for you.
If you'd like to add custom stop-loss or take-profit calculations, or include Fibonacci levels, let me know!
