Multi-Timeframe RSI Resonance Indicator (MTF RSI)
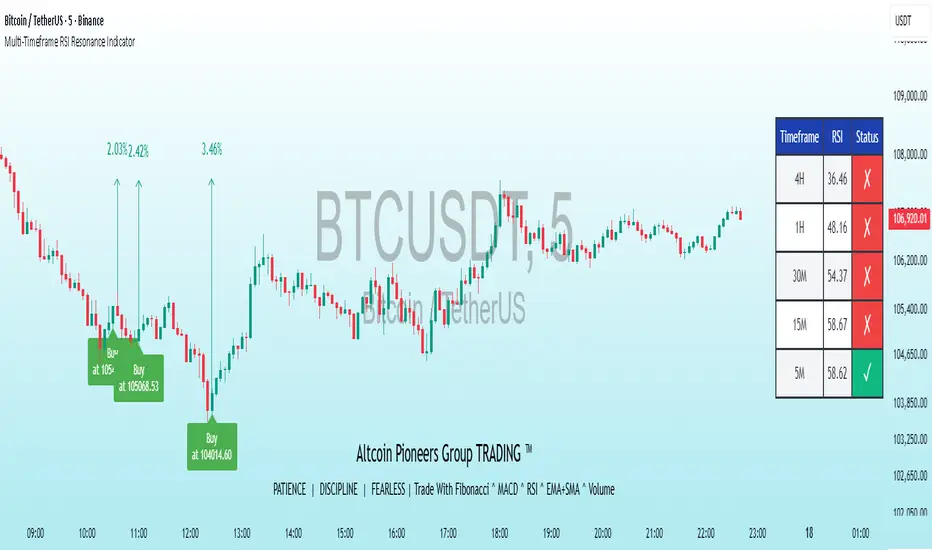
This indicator combines RSI values across multiple timeframes (4H, 1H, 30M, 15M, and 5M) to identify potential resonance signals for oversold and overbought conditions. It's designed for traders looking to align higher timeframe trends with lower timeframe triggers on a 5-minute chart.
Key Features:
- Buy Signal: Triggers when RSI on 4H, 1H, 30M, and 15M is below the oversold threshold (default: 20), and 5M RSI crosses above it. Visualized with a green "Buy at [price]" label below the bar.
- Sell Signal: Triggers when RSI on 1H, 30M, and 15M is above the overbought threshold (default: 80), and 5M RSI crosses below it. Visualized with an orange "Sell at [price]" label above the bar.
- Information Table: Displays live RSI values and status for each timeframe in a sidebar table (e.g., ✓ for oversold confirmation on higher TFs).
- Background Highlight: Subtle red tint when all timeframes are oversold.
- Alerts: Built-in conditions for buy/sell notifications with entry price.
How to Use:
1. Apply to a 5-minute chart for best results (as 5M acts as the trigger).
2. Customize thresholds via inputs: RSI Length (default: 14), Oversold (20), Overbought (80).
3. Use in conjunction with other analysis tools—higher timeframes provide confluence, while 5M offers entry timing.
Important Disclaimer: This is for educational and informational purposes only. It does not constitute financial, investment, or trading advice. Past performance is not indicative of future results. Always conduct your own research and consider your risk tolerance before trading. The author is not responsible for any trading decisions or losses.
สคริปต์แบบเฉพาะผู้ได้รับเชิญเท่านั้น
เฉพาะผู้ใช้ที่ได้รับการอนุมัติจากผู้เขียนเท่านั้นที่สามารถเข้าถึงสคริปต์นี้ได้ คุณจะต้องร้องขอและได้รับอนุญาตก่อนจึงจะสามารถใช้งานได้ โดยปกติจะได้รับอนุญาตหลังจากชำระเงินแล้ว สำหรับรายละเอียดเพิ่มเติม ทำตามคำแนะนำของผู้เขียนด้านล่างหรือติดต่อ AltcoinPiooners โดยตรง
TradingView ไม่แนะนำให้ชำระเงินหรือใช้สคริปต์ เว้นแต่ว่าคุณจะเชื่อถือผู้เขียนสคริปต์และเข้าใจวิธีการทำงานของมัน คุณยังอาจพบทางเลือกของโอเพนซอร์ส แบบฟรีในสคริปต์ชุมชนของเรา
คำแนะนำของผู้เขียน
t.me/AltcoinPiooners
✅Personal Telegram (Premium)
t.me/Altcoin_Piooners
✅YouTube
youtube.com/@AltcoinPiooners
คำจำกัดสิทธิ์ความรับผิดชอบ
สคริปต์แบบเฉพาะผู้ได้รับเชิญเท่านั้น
เฉพาะผู้ใช้ที่ได้รับการอนุมัติจากผู้เขียนเท่านั้นที่สามารถเข้าถึงสคริปต์นี้ได้ คุณจะต้องร้องขอและได้รับอนุญาตก่อนจึงจะสามารถใช้งานได้ โดยปกติจะได้รับอนุญาตหลังจากชำระเงินแล้ว สำหรับรายละเอียดเพิ่มเติม ทำตามคำแนะนำของผู้เขียนด้านล่างหรือติดต่อ AltcoinPiooners โดยตรง
TradingView ไม่แนะนำให้ชำระเงินหรือใช้สคริปต์ เว้นแต่ว่าคุณจะเชื่อถือผู้เขียนสคริปต์และเข้าใจวิธีการทำงานของมัน คุณยังอาจพบทางเลือกของโอเพนซอร์ส แบบฟรีในสคริปต์ชุมชนของเรา
คำแนะนำของผู้เขียน
t.me/AltcoinPiooners
✅Personal Telegram (Premium)
t.me/Altcoin_Piooners
✅YouTube
youtube.com/@AltcoinPiooners