OPEN-SOURCE SCRIPT
MACD with Candle Display
MACD Calculation:
Uses user-defined Fast Length, Slow Length, and Signal Smoothing parameters to compute MACD.
Supports SMA (Simple Moving Average) or EMA (Exponential Moving Average) for the MACD line and signal line
Histogram-Based Candle Coloring:
The script categorizes histogram bars into four states:
0 (Very Bullish) → Green
1 (Likely Bearish) → Blue
2 (Likely Bullish) → Orange
3 (Very Bearish) → Red
Histogram Plot:
Displays histogram bars with distinct colors based on price momentum changes.
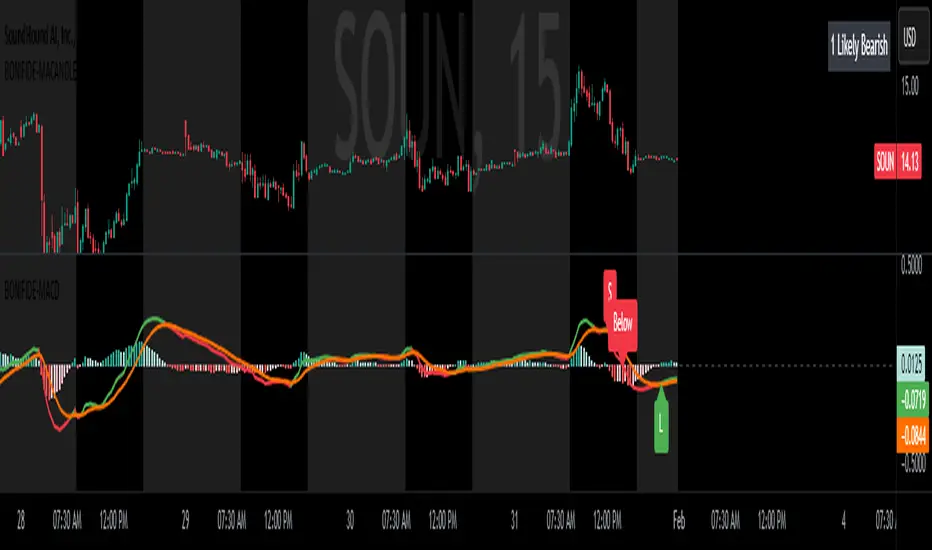
Market Sentiment Display in Status Line & Price Scale:
Instead of adding a label on the chart (which could obstruct candles), a text display is shown in the price scale and status line:
"0 Very Bullish"
"1 Likely Bearish"
"2 Likely Bullish"
"3 Very Bearish"
The text appears in the top-right corner with white font on a black background.
Purpose:
This indicator enhances the standard MACD by incorporating candle coloring and a cleaner sentiment display in the price scale, helping traders quickly interpret market momentum without cluttering the chart.
Uses user-defined Fast Length, Slow Length, and Signal Smoothing parameters to compute MACD.
Supports SMA (Simple Moving Average) or EMA (Exponential Moving Average) for the MACD line and signal line
Histogram-Based Candle Coloring:
The script categorizes histogram bars into four states:
0 (Very Bullish) → Green
1 (Likely Bearish) → Blue
2 (Likely Bullish) → Orange
3 (Very Bearish) → Red
Histogram Plot:
Displays histogram bars with distinct colors based on price momentum changes.
Market Sentiment Display in Status Line & Price Scale:
Instead of adding a label on the chart (which could obstruct candles), a text display is shown in the price scale and status line:
"0 Very Bullish"
"1 Likely Bearish"
"2 Likely Bullish"
"3 Very Bearish"
The text appears in the top-right corner with white font on a black background.
Purpose:
This indicator enhances the standard MACD by incorporating candle coloring and a cleaner sentiment display in the price scale, helping traders quickly interpret market momentum without cluttering the chart.
สคริปต์โอเพนซอร์ซ
ด้วยเจตนารมณ์หลักของ TradingView ผู้สร้างสคริปต์นี้ได้ทำให้เป็นโอเพนซอร์ส เพื่อให้เทรดเดอร์สามารถตรวจสอบและยืนยันฟังก์ชันการทำงานของมันได้ ขอชื่นชมผู้เขียน! แม้ว่าคุณจะใช้งานได้ฟรี แต่โปรดจำไว้ว่าการเผยแพร่โค้ดซ้ำจะต้องเป็นไปตาม กฎระเบียบการใช้งาน ของเรา
คำจำกัดสิทธิ์ความรับผิดชอบ
ข้อมูลและบทความไม่ได้มีวัตถุประสงค์เพื่อก่อให้เกิดกิจกรรมทางการเงิน, การลงทุน, การซื้อขาย, ข้อเสนอแนะ หรือคำแนะนำประเภทอื่น ๆ ที่ให้หรือรับรองโดย TradingView อ่านเพิ่มเติมใน ข้อกำหนดการใช้งาน