OPEN-SOURCE SCRIPT
ที่อัปเดต: PEV Price Band
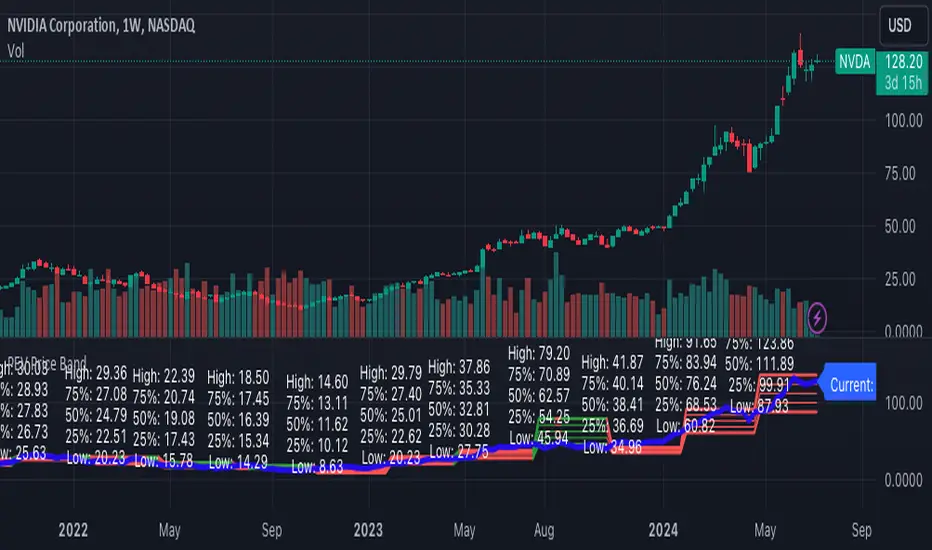
The PEV Price Band shows prices calculated using the high and low P/FQ EV of the previous period. (price to enterprise value per share for the last quarter) multiplied by FQ's current EVPS (similar to comparing marketcap to enterprise value but edit equations that are close to the theory of P/E)
If the current price is lower than the minimum P/EVPS, it is considered cheap. In other words, a current price is above the maximum is considered expensive.
PEV Price Band consists of 2 parts.
- First of all, the current P/EVPS value is "green" (if the markecap is less than the enterprise value) or "red" (if the marketcap is more than the enterprise value) or "gold" (if the market value is less than the enterprise value and less than equity)
- Second, the blue line is the closing price.
เอกสารเผยแพร่
1. Fixed bug in 5000 bars in day timeframe- Added attribute "calc_bars_count = 5000" in indicator
2. Changed "TOTAL_SHARES_OUTSTANDING" to "DILUTED_SHARES_OUTSTANDING"
3. Changed condition from checking uptrend condition to current price less than enterprise value for easy understanding
สคริปต์โอเพนซอร์ซ
ด้วยเจตนารมณ์หลักของ TradingView ผู้สร้างสคริปต์นี้ได้ทำให้เป็นโอเพนซอร์ส เพื่อให้เทรดเดอร์สามารถตรวจสอบและยืนยันฟังก์ชันการทำงานของมันได้ ขอชื่นชมผู้เขียน! แม้ว่าคุณจะใช้งานได้ฟรี แต่โปรดจำไว้ว่าการเผยแพร่โค้ดซ้ำจะต้องเป็นไปตาม กฎระเบียบการใช้งาน ของเรา
คำจำกัดสิทธิ์ความรับผิดชอบ
ข้อมูลและบทความไม่ได้มีวัตถุประสงค์เพื่อก่อให้เกิดกิจกรรมทางการเงิน, การลงทุน, การซื้อขาย, ข้อเสนอแนะ หรือคำแนะนำประเภทอื่น ๆ ที่ให้หรือรับรองโดย TradingView อ่านเพิ่มเติมใน ข้อกำหนดการใช้งาน