PROTECTED SOURCE SCRIPT
ที่อัปเดต: Alpha -> PROFABIGHI CAPITAL
🌟 Overview
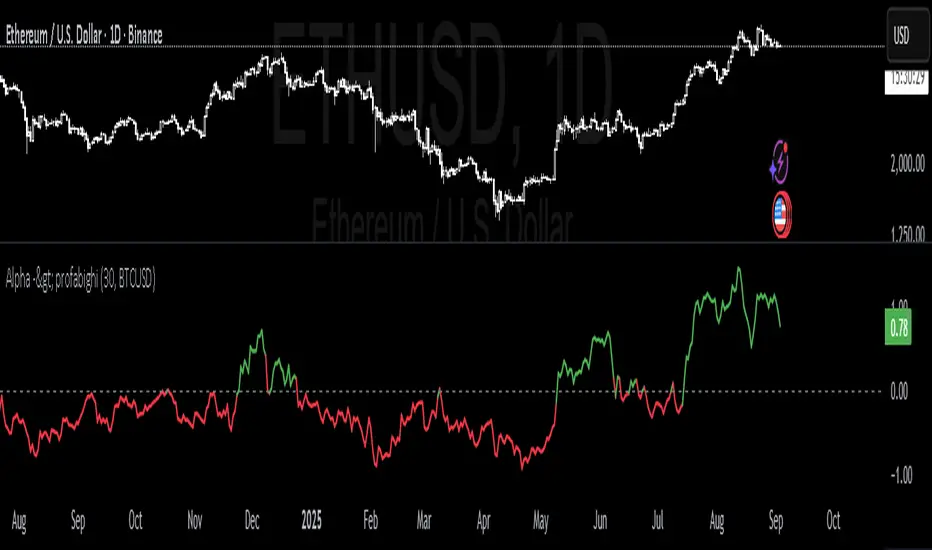
The Alpha → PROFABIGHI CAPITAL indicator calculates the excess return performance of any asset relative to a chosen benchmark using beta coefficient analysis and risk-adjusted return measurement. It combines covariance calculation, variance analysis, and return averaging across (Asset Returns, Benchmark Returns, Beta Coefficient) with rolling window calculations. The indicator features automated alpha generation detection through statistical correlation analysis and zero-division protection for reliable performance measurement.
⚙️ General Settings
– Lookback Period: Number of bars for calculating rolling statistics and correlations (1-500 bars, default: 30).
– Benchmark Symbol: Reference market index for comparison (default: CRYPTO:BTCUSD).
– Overlay Setting: False - displays as separate pane oscillator for clear alpha visualization.
📊 Alpha Calculation Components & Methods
The indicator calculates multiple performance metrics using statistical methods:
- Asset Returns: Rate of change calculations for current asset price movements per bar
- Benchmark Returns: Rate of change calculations for benchmark price movements per bar
- Mean Asset Returns: Simple moving average of asset returns over lookback period
- Mean Benchmark Returns: Simple moving average of benchmark returns over lookback period
- Covariance Calculation: Manual computation measuring how asset and benchmark move together
- Benchmark Variance: Manual calculation of benchmark return volatility and dispersion
- Beta Coefficient: Covariance divided by benchmark variance with zero-division protection
- Alpha Calculation: Mean asset returns minus beta multiplied by mean benchmark returns
📈 Advanced Statistical Features
Rolling Window Analysis:
- Dynamic Lookback: All calculations use specified lookback period for current relevance
- Continuous Updates: Statistics recalculated with each new bar for real-time analysis
- Moving Averages: Simple moving average calculations for return smoothing
Security Data Integration:
- Multi-Symbol Processing: Fetches benchmark data using security request function
- Timeframe Matching: Uses current chart timeframe for benchmark data synchronization
- Close Price Focus: Utilizes closing prices for both asset and benchmark calculations
Mathematical Protection:
- Zero-Division Check: Conditional logic prevents division by zero in beta calculation
- NA Value Handling: Returns 'na' when benchmark variance equals zero
- Robust Framework: Maintains functionality when calculations become undefined
📏 Signal Levels & Interpretation
– Positive Alpha (Green): Asset returns exceed beta-adjusted benchmark performance
– Negative Alpha (Red): Asset returns fall below beta-adjusted benchmark performance
– Zero Line Reference: Horizontal dashed line marking neutral alpha level
– Alpha Magnitude: Higher absolute values indicate stronger relative performance
– Color-Coded Display: Automatic green/red formatting based on positive/negative values
📋 Mathematical Framework
Core Calculation Process:
- Return Calculation: Rate of change for both asset and benchmark over single periods
- Mean Return Smoothing: Simple moving averages applied to return streams
- Covariance Formula: Average of return products minus product of mean returns
- Variance Formula: Average of squared returns minus squared mean returns
- Beta Derivation: Covariance divided by benchmark variance
- Alpha Formula: Asset mean return minus beta times benchmark mean return
🎨 Visual Features
– Alpha Line Plot: Main alpha visualization with 2-pixel line thickness
– Conditional Coloring: Green for positive alpha, red for negative alpha values
– Enhanced Visibility: Thick line format for clear trend identification
– Zero Reference Line: Gray dashed horizontal line at zero level
– Separate Display Pane: Independent oscillator panel below price chart
🔍 Advanced Features
– Real-Time Calculation: Updates automatically with each new price bar
– Manual Statistical Computation: Direct covariance and variance calculations for precision
– Benchmark Flexibility: Any tradable symbol can serve as performance reference
– Error Prevention: Built-in zero-division protection for reliable operation
– Multi-Asset Compatibility: Works across different asset classes and markets
– Rolling Window Methodology: Maintains specified lookback period for all calculations
🔔 Performance Signals
– Alpha Positive Crossover: When alpha value moves above zero line
– Alpha Negative Crossover: When alpha value moves below zero line
– Sustained Alpha Trends: Consistent positive or negative alpha over multiple periods
– Alpha Magnitude Changes: Increasing or decreasing strength of relative performance
– Beta-Adjusted Comparison: Performance measurement accounting for systematic risk correlation
By utilizing rolling statistical calculations and beta-adjusted return analysis, the Alpha → PROFABIGHI CAPITAL indicator provides mathematically sound relative performance measurement, offering accurate identification of excess return generation through systematic covariance and variance analysis with comprehensive zero-division protection.
เอกสารเผยแพร่
.สคริปต์ที่ได้รับการป้องกัน
สคริปต์นี้ถูกเผยแพร่เป็นแบบ closed-source อย่างไรก็ตาม คุณสามารถใช้ได้อย่างอิสระและไม่มีข้อจำกัดใดๆ – เรียนรู้เพิ่มเติมได้ที่นี่
คำจำกัดสิทธิ์ความรับผิดชอบ
ข้อมูลและบทความไม่ได้มีวัตถุประสงค์เพื่อก่อให้เกิดกิจกรรมทางการเงิน, การลงทุน, การซื้อขาย, ข้อเสนอแนะ หรือคำแนะนำประเภทอื่น ๆ ที่ให้หรือรับรองโดย TradingView อ่านเพิ่มเติมที่ ข้อกำหนดการใช้งาน
สคริปต์ที่ได้รับการป้องกัน
สคริปต์นี้ถูกเผยแพร่เป็นแบบ closed-source อย่างไรก็ตาม คุณสามารถใช้ได้อย่างอิสระและไม่มีข้อจำกัดใดๆ – เรียนรู้เพิ่มเติมได้ที่นี่
คำจำกัดสิทธิ์ความรับผิดชอบ
ข้อมูลและบทความไม่ได้มีวัตถุประสงค์เพื่อก่อให้เกิดกิจกรรมทางการเงิน, การลงทุน, การซื้อขาย, ข้อเสนอแนะ หรือคำแนะนำประเภทอื่น ๆ ที่ให้หรือรับรองโดย TradingView อ่านเพิ่มเติมที่ ข้อกำหนดการใช้งาน