OPEN-SOURCE SCRIPT
CryptoMedication's Volatility RSI
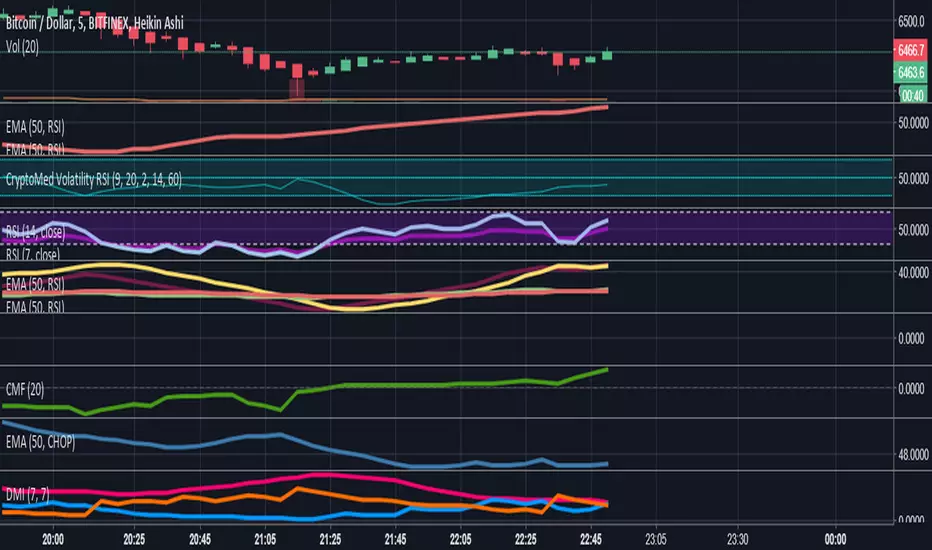
So, here's what we ended up doing for the most recent one that we created.
1. We took the ATR (Average True Range) - You can read about that here: medium.com/thedailydose/average-true-range-atr-lesson-26ee37c599cd
2. Then applied the Bollinger Bands %B to it
3. Then overlayed it with another indicator
Purpose:
The general purpose of this indicator is to identify when there are periods of consolidation or if there were be a large increase in the price (going either way). However, we were able to plug this in so that it connected with the RSI (after cancelling out the noise and smoothing values*making it scaled out evenly), so that it also produces buy/sell signals.
If you're interested to get a more in-depth overview of how this works, visit this link here: medium.com/thedailydose/cryptomedication-volatility-rsi-72d6dcc2d8bb
สคริปต์โอเพนซอร์ซ
ด้วยเจตนารมณ์หลักของ TradingView ผู้สร้างสคริปต์นี้ได้ทำให้เป็นโอเพนซอร์ส เพื่อให้เทรดเดอร์สามารถตรวจสอบและยืนยันฟังก์ชันการทำงานของมันได้ ขอชื่นชมผู้เขียน! แม้ว่าคุณจะใช้งานได้ฟรี แต่โปรดจำไว้ว่าการเผยแพร่โค้ดซ้ำจะต้องเป็นไปตาม กฎระเบียบการใช้งาน ของเรา
คำจำกัดสิทธิ์ความรับผิดชอบ
ข้อมูลและบทความไม่ได้มีวัตถุประสงค์เพื่อก่อให้เกิดกิจกรรมทางการเงิน, การลงทุน, การซื้อขาย, ข้อเสนอแนะ หรือคำแนะนำประเภทอื่น ๆ ที่ให้หรือรับรองโดย TradingView อ่านเพิ่มเติมใน ข้อกำหนดการใช้งาน