OPEN-SOURCE SCRIPT
Climax Detector (Buy & Sell)
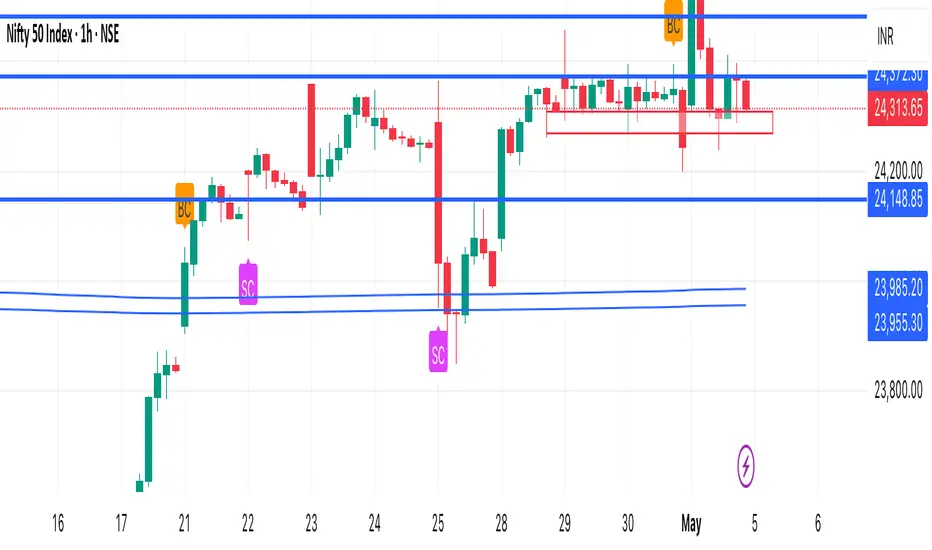
This indicator identifies potential Buying Climax (BC) and Selling Climax (SC) events based on volume spikes relative to historical averages.
• Buying Climax (BC):
• Detected when a green candle forms with volume significantly higher than the average (default: 2×).
• Often signals the end of an uptrend or distribution phase.
• Selling Climax (SC):
• Detected when a red candle forms with very high volume (default: 2× average).
• Often occurs at the end of a downtrend, suggesting panic selling and potential accumulation.
How it works:
• Calculates a moving average of volume over a user-defined period (default: 20 candles)
• Flags a climax when current volume exceeds the defined multiplier (default: 2.0×)
• Marks:
• BC with an orange triangle above the bar
• SC with a fuchsia triangle below the bar
Customizable Settings:
• Volume spike sensitivity
• Lookback period for average volume
Use Cases:
• Spot possible trend exhaustion
• Confirm Wyckoff phases
• Combine with support/resistance for reversal entries
Disclaimer: This tool is designed to assist in identifying high-probability exhaustion zones but should be used alongside other confirmations or strategies.
สคริปต์โอเพนซอร์ซ
ด้วยเจตนารมณ์หลักของ TradingView ผู้สร้างสคริปต์นี้ได้ทำให้เป็นโอเพนซอร์ส เพื่อให้เทรดเดอร์สามารถตรวจสอบและยืนยันฟังก์ชันการทำงานของมันได้ ขอชื่นชมผู้เขียน! แม้ว่าคุณจะใช้งานได้ฟรี แต่โปรดจำไว้ว่าการเผยแพร่โค้ดซ้ำจะต้องเป็นไปตาม กฎระเบียบการใช้งาน ของเรา
คำจำกัดสิทธิ์ความรับผิดชอบ
ข้อมูลและบทความไม่ได้มีวัตถุประสงค์เพื่อก่อให้เกิดกิจกรรมทางการเงิน, การลงทุน, การซื้อขาย, ข้อเสนอแนะ หรือคำแนะนำประเภทอื่น ๆ ที่ให้หรือรับรองโดย TradingView อ่านเพิ่มเติมใน ข้อกำหนดการใช้งาน