OPEN-SOURCE SCRIPT
Drawing tool
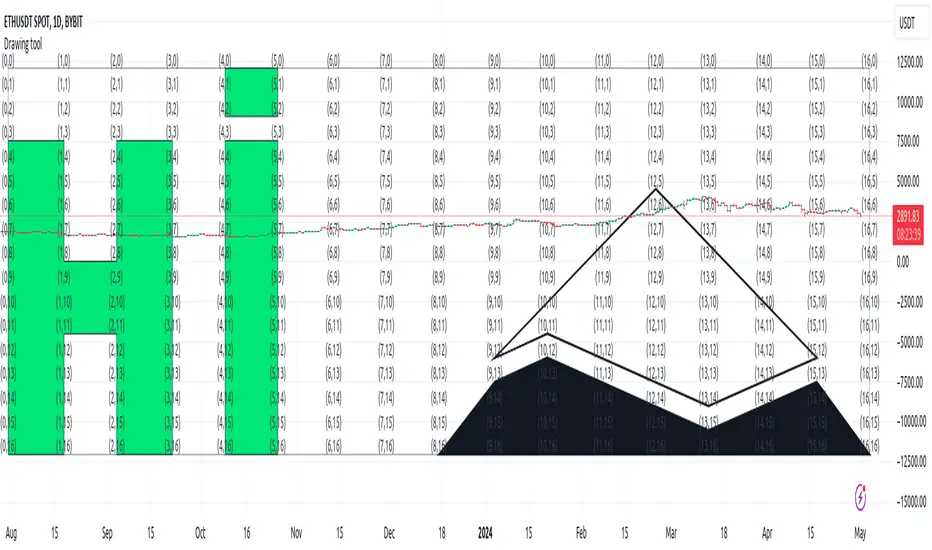
This indicator is a simple drawing tool without changing the code!
You need:
1. activate the display of coordinates (Show coordinate input)
You will see a 17 by 17 table with indexes of intersection points, in the format: (x,y)
2. activate the Enable custom drawing input
3. enter the sequence of points that you want to connect into the Coordinate for drawing input in the format: (x,y);(x,y)....
4. select line color and fill color
5. if necessary, activate Curved and Closed
In addition, you can look at some examples
สคริปต์โอเพนซอร์ซ
ด้วยเจตนารมณ์หลักของ TradingView ผู้สร้างสคริปต์นี้ได้ทำให้เป็นโอเพนซอร์ส เพื่อให้เทรดเดอร์สามารถตรวจสอบและยืนยันฟังก์ชันการทำงานของมันได้ ขอชื่นชมผู้เขียน! แม้ว่าคุณจะใช้งานได้ฟรี แต่โปรดจำไว้ว่าการเผยแพร่โค้ดซ้ำจะต้องเป็นไปตาม กฎระเบียบการใช้งาน ของเรา
คำจำกัดสิทธิ์ความรับผิดชอบ
ข้อมูลและบทความไม่ได้มีวัตถุประสงค์เพื่อก่อให้เกิดกิจกรรมทางการเงิน, การลงทุน, การซื้อขาย, ข้อเสนอแนะ หรือคำแนะนำประเภทอื่น ๆ ที่ให้หรือรับรองโดย TradingView อ่านเพิ่มเติมใน ข้อกำหนดการใช้งาน