PROTECTED SOURCE SCRIPT
ADR Bottom-Right TABLE Dashboard
Title: ADR Bottom-Right Dashboard
Version: 1.0
Author: [Your Name]
Description:
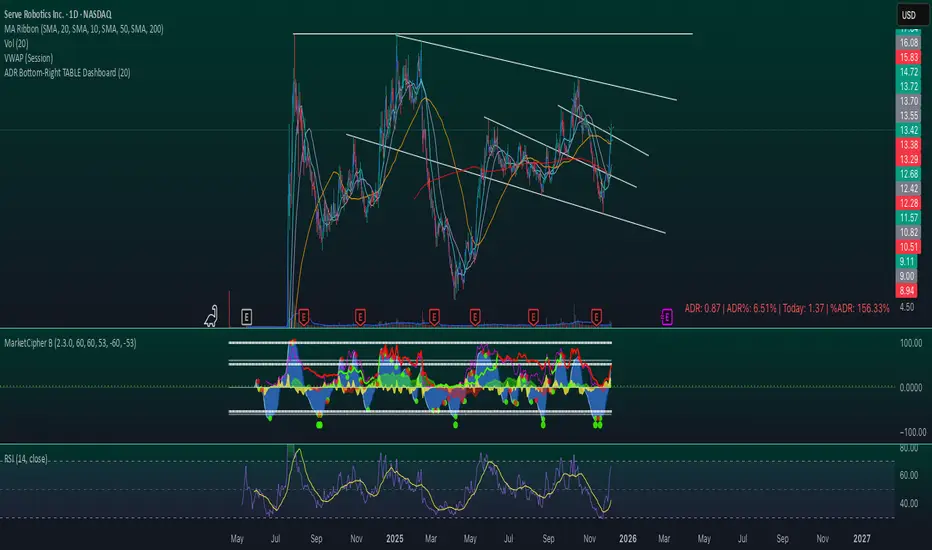
The ADR Bottom-Right Dashboard displays the Average Daily Range (ADR) and related metrics directly on your chart in a compact, easy-to-read table. It helps traders quickly see how much a stock has moved today relative to its normal daily range and identify potential overextended or trending moves.
This tool is ideal for swing traders, day traders, and scalpers who want a real-time, visual indication of volatility and intraday movement.
Features
ADR (Average Daily Range): Shows the average high-to-low movement over a customizable period (default 20 days).
ADR%: ADR as a percentage of the stock price, showing relative volatility.
Today: The current intraday range (high–low).
%ADR: How much of the ADR has already been reached today. Color-coded to indicate low, medium, or high extension.
Color coding: %ADR highlights:
Green: <50% (early-day / low volatility)
Yellow: 50–100% (normal movement)
Red: >100% (extended move / potential exhaustion)
Inputs
Input Description Default
ADR Period Number of days to calculate the ADR 20
Low %ADR Color Color for %ADR <50% Green
Medium %ADR Color Color for %ADR 50–100% Yellow
High %ADR Color Color for %ADR >100% Red
Version: 1.0
Author: [Your Name]
Description:
The ADR Bottom-Right Dashboard displays the Average Daily Range (ADR) and related metrics directly on your chart in a compact, easy-to-read table. It helps traders quickly see how much a stock has moved today relative to its normal daily range and identify potential overextended or trending moves.
This tool is ideal for swing traders, day traders, and scalpers who want a real-time, visual indication of volatility and intraday movement.
Features
ADR (Average Daily Range): Shows the average high-to-low movement over a customizable period (default 20 days).
ADR%: ADR as a percentage of the stock price, showing relative volatility.
Today: The current intraday range (high–low).
%ADR: How much of the ADR has already been reached today. Color-coded to indicate low, medium, or high extension.
Color coding: %ADR highlights:
Green: <50% (early-day / low volatility)
Yellow: 50–100% (normal movement)
Red: >100% (extended move / potential exhaustion)
Inputs
Input Description Default
ADR Period Number of days to calculate the ADR 20
Low %ADR Color Color for %ADR <50% Green
Medium %ADR Color Color for %ADR 50–100% Yellow
High %ADR Color Color for %ADR >100% Red
สคริปต์ที่ได้รับการป้องกัน
สคริปต์นี้ถูกเผยแพร่เป็นแบบ closed-source อย่างไรก็ตาม คุณสามารถใช้ได้อย่างอิสระและไม่มีข้อจำกัดใดๆ – เรียนรู้เพิ่มเติมได้ที่นี่
คำจำกัดสิทธิ์ความรับผิดชอบ
ข้อมูลและบทความไม่ได้มีวัตถุประสงค์เพื่อก่อให้เกิดกิจกรรมทางการเงิน, การลงทุน, การซื้อขาย, ข้อเสนอแนะ หรือคำแนะนำประเภทอื่น ๆ ที่ให้หรือรับรองโดย TradingView อ่านเพิ่มเติมใน ข้อกำหนดการใช้งาน