OPEN-SOURCE SCRIPT
true trend
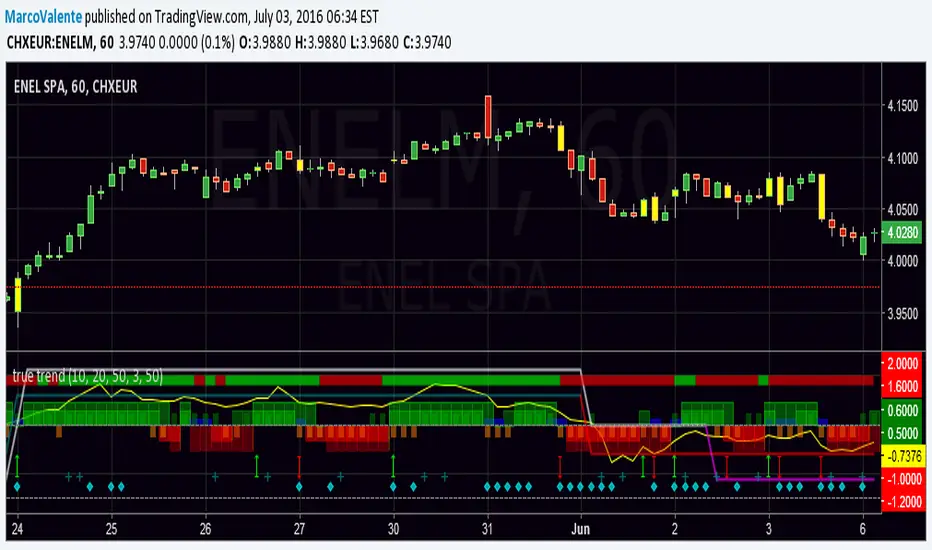
Easy way to look at the Trend , but still accurate. Top bar is DI +, DI - , bars change in yellow when a swing happen, histogram show the increase/decrease of Min and Max and Open-Close; 2 lines moving between +1 and - 1 folloiwng 3 Ema crossing ; a Dot (diamond shape) appear on the botton when volatility increase and finally a " + " show when volume are much bigger the usually. Yellow line on top is Willams % and help us to find top and bottom of the market.
สคริปต์โอเพนซอร์ซ
ด้วยเจตนารมณ์หลักของ TradingView ผู้สร้างสคริปต์นี้ได้ทำให้เป็นโอเพนซอร์ส เพื่อให้เทรดเดอร์สามารถตรวจสอบและยืนยันฟังก์ชันการทำงานของมันได้ ขอชื่นชมผู้เขียน! แม้ว่าคุณจะใช้งานได้ฟรี แต่โปรดจำไว้ว่าการเผยแพร่โค้ดซ้ำจะต้องเป็นไปตาม กฎระเบียบการใช้งาน ของเรา
คำจำกัดสิทธิ์ความรับผิดชอบ
ข้อมูลและบทความไม่ได้มีวัตถุประสงค์เพื่อก่อให้เกิดกิจกรรมทางการเงิน, การลงทุน, การซื้อขาย, ข้อเสนอแนะ หรือคำแนะนำประเภทอื่น ๆ ที่ให้หรือรับรองโดย TradingView อ่านเพิ่มเติมใน ข้อกำหนดการใช้งาน