OPEN-SOURCE SCRIPT
ที่อัปเดต: Opening Score with Divergence
Overview
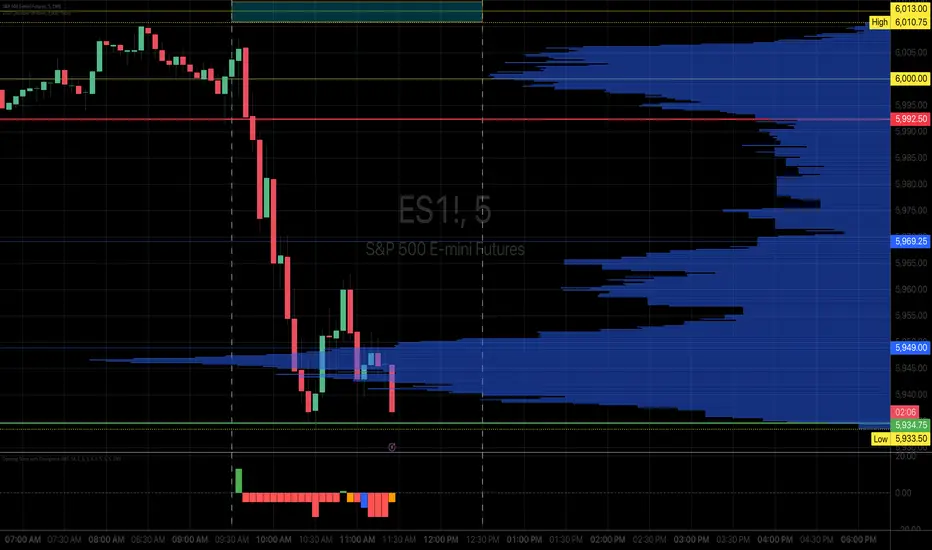
The Opening Score Indicator is a versatile tool designed to help traders assess market sentiment, trend direction, and potential reversals. By combining Opening Range Breakout (ORB), VWAP, Trend, Volatility, and Divergence Detection, this indicator provides a composite score that adapts to different market conditions.
This version includes divergence detection between the Opening Score and price, which highlights potential trend reversals or continuations before they happen. When a regular divergence occurs, the histogram bar turns orange, signaling an increased probability of a trend change.
Best for Both Intraday & Longer-Term Charts
📊 Optimized for intraday trading → Works well on 1m to 30m timeframes for short-term strategies.
📈 Also effective on longer-term charts → Can be used on 1-hour, 4-hour, daily, or weekly charts to identify macro trends and momentum shifts.
🕰️ Adapts to different market conditions → Whether you’re a day trader, swing trader, or position trader, the Opening Score helps you track trend health and reversals.
How It Works
📊 Composite Opening Score Calculation
• ORB Signal → Detects bullish/bearish breakouts based on the opening range.
• VWAP Signal → Measures price positioning relative to VWAP for trend confirmation.
• Trend Signal → Uses a moving average to determine market direction.
• Volatility Signal → Tracks ATR changes to assess market strength.
• Divergence Detection → Identifies regular and hidden divergences for potential reversals or trend continuation.
🔹 Reversal Alerts with Color-Coded Histogram
• Green Bars → Normal bullish Opening Score.
• Red Bars → Normal bearish Opening Score.
• Orange Bars → Warning! Regular Divergence detected → Possible trend reversal.
🔹 Hidden & Regular Divergence Detection
• Regular Divergence (Reversal Signals)
• 📉 Bearish Regular Divergence → Price makes a Higher High, but Opening Score makes a Lower High → 🔻 Possible Downtrend Reversal.
• 📈 Bullish Regular Divergence → Price makes a Lower Low, but Opening Score makes a Higher Low → 🔼 Possible Uptrend Reversal.
• Hidden Divergence (Trend Continuation Signals)
• 📉 Bearish Hidden Divergence → Price makes a Lower High, but Opening Score makes a Higher High → 🔻 Trend Likely to Continue Down.
• 📈 Bullish Hidden Divergence → Price makes a Higher Low, but Opening Score makes a Lower Low → 🔼 Trend Likely to Continue Up.
How to Use It
✅ Watch for Reversal Alerts (Orange Bars) → These highlight potential market turning points.
✅ Use the Zero Line as a Trend Filter → A score above 0 suggests bullish conditions, while below 0 signals bearish conditions.
✅ Combine with Market Structure & Volume Profile → Works well when paired with support/resistance levels, liquidity zones, and order flow data.
✅ Adjust settings based on timeframe → Increase moving average length & lookback periods for longer-term analysis.
Why Use This Indicator?
🚀 Works for both short-term and long-term traders → Adapts to intraday and higher timeframes.
📊 Multi-Factor Analysis → Combines multiple key market indicators for better accuracy.
🎯 Customizable Weighting → Adjust the influence of each signal to suit your trading style.
✅ No Clutter – Only the Opening Score is plotted → Keeps your chart clean & efficient.
🔔 Recommended for Intraday Trading (1m – 30m) AND Longer-Term Analysis (1H – Weekly) → Use this indicator to enhance your trend detection & reversal strategy! 🚀
เอกสารเผยแพร่
OverviewThe Opening Score Indicator is a versatile tool designed to help traders assess market sentiment, trend direction, and potential reversals. By combining Opening Range Breakout (ORB), VWAP, Trend, Volatility, and Divergence Detection, this indicator provides a composite score that adapts to different market conditions.
This version includes divergence detection between the Opening Score and price, which highlights potential trend reversals or continuations before they happen. When a regular divergence occurs, the histogram bar turns orange, signaling an increased probability of a trend change.
Best for Both Intraday & Longer-Term Charts
📊 Optimized for intraday trading → Works well on 1m to 30m timeframes for short-term strategies.
📈 Also effective on longer-term charts → Can be used on 1-hour, 4-hour, daily, or weekly charts to identify macro trends and momentum shifts.
🕰️ Adapts to different market conditions → Whether you’re a day trader, swing trader, or position trader, the Opening Score helps you track trend health and reversals.
How It Works
📊 Composite Opening Score Calculation
• ORB Signal → Detects bullish/bearish breakouts based on the opening range.
• VWAP Signal → Measures price positioning relative to VWAP for trend confirmation.
• Trend Signal → Uses a moving average to determine market direction.
• Volatility Signal → Tracks ATR changes to assess market strength.
• Divergence Detection → Identifies regular and hidden divergences for potential reversals or trend continuation.
🔹 Reversal Alerts with Color-Coded Histogram
• Green Bars → Normal bullish Opening Score.
• Red Bars → Normal bearish Opening Score.
• Orange Bars → Warning! Regular Divergence detected → Possible trend reversal.
🔹 Hidden & Regular Divergence Detection
• Regular Divergence (Reversal Signals)
• 📉 Bearish Regular Divergence → Price makes a Higher High, but Opening Score makes a Lower High → 🔻 Possible Downtrend Reversal.
• 📈 Bullish Regular Divergence → Price makes a Lower Low, but Opening Score makes a Higher Low → 🔼 Possible Uptrend Reversal.
• Hidden Divergence (Trend Continuation Signals)
• 📉 Bearish Hidden Divergence → Price makes a Lower High, but Opening Score makes a Higher High → 🔻 Trend Likely to Continue Down.
• 📈 Bullish Hidden Divergence → Price makes a Higher Low, but Opening Score makes a Lower Low → 🔼 Trend Likely to Continue Up.
How to Use It
✅ Watch for Reversal Alerts (Orange Bars) → These highlight potential market turning points.
✅ Use the Zero Line as a Trend Filter → A score above 0 suggests bullish conditions, while below 0 signals bearish conditions.
✅ Combine with Market Structure & Volume Profile → Works well when paired with support/resistance levels, liquidity zones, and order flow data.
✅ Adjust settings based on timeframe → Increase moving average length & lookback periods for longer-term analysis.
Why Use This Indicator?
🚀 Works for both short-term and long-term traders → Adapts to intraday and higher timeframes.
📊 Multi-Factor Analysis → Combines multiple key market indicators for better accuracy.
🎯 Customizable Weighting → Adjust the influence of each signal to suit your trading style.
✅ No Clutter – Only the Opening Score is plotted → Keeps your chart clean & efficient.
🔔 Recommended for Intraday Trading (1m – 30m) AND Longer-Term Analysis (1H – Weekly) → Use this indicator to enhance your trend detection & reversal strategy! 🚀
เอกสารเผยแพร่
Changed the color labeling method in settings, minor changes to the strategies.สคริปต์โอเพนซอร์ซ
ด้วยเจตนารมณ์หลักของ TradingView ผู้สร้างสคริปต์นี้ได้ทำให้เป็นโอเพนซอร์ส เพื่อให้เทรดเดอร์สามารถตรวจสอบและยืนยันฟังก์ชันการทำงานของมันได้ ขอชื่นชมผู้เขียน! แม้ว่าคุณจะใช้งานได้ฟรี แต่โปรดจำไว้ว่าการเผยแพร่โค้ดซ้ำจะต้องเป็นไปตาม กฎระเบียบการใช้งาน ของเรา
I provide expert guidance for crypto traders using Volume Profile and pattern recognition tech
คำจำกัดสิทธิ์ความรับผิดชอบ
ข้อมูลและบทความไม่ได้มีวัตถุประสงค์เพื่อก่อให้เกิดกิจกรรมทางการเงิน, การลงทุน, การซื้อขาย, ข้อเสนอแนะ หรือคำแนะนำประเภทอื่น ๆ ที่ให้หรือรับรองโดย TradingView อ่านเพิ่มเติมใน ข้อกำหนดการใช้งาน
สคริปต์โอเพนซอร์ซ
ด้วยเจตนารมณ์หลักของ TradingView ผู้สร้างสคริปต์นี้ได้ทำให้เป็นโอเพนซอร์ส เพื่อให้เทรดเดอร์สามารถตรวจสอบและยืนยันฟังก์ชันการทำงานของมันได้ ขอชื่นชมผู้เขียน! แม้ว่าคุณจะใช้งานได้ฟรี แต่โปรดจำไว้ว่าการเผยแพร่โค้ดซ้ำจะต้องเป็นไปตาม กฎระเบียบการใช้งาน ของเรา
I provide expert guidance for crypto traders using Volume Profile and pattern recognition tech
คำจำกัดสิทธิ์ความรับผิดชอบ
ข้อมูลและบทความไม่ได้มีวัตถุประสงค์เพื่อก่อให้เกิดกิจกรรมทางการเงิน, การลงทุน, การซื้อขาย, ข้อเสนอแนะ หรือคำแนะนำประเภทอื่น ๆ ที่ให้หรือรับรองโดย TradingView อ่านเพิ่มเติมใน ข้อกำหนดการใช้งาน