RSI Pulsar [QuantraSystems]
Introduction
The RSI Pulsar is an advanced and multifaceted tool designed to cater to the varying needs of traders, from long-term swing traders to higher-frequency day traders. This indicator takes the Relative Strength Index (RSI) to new heights by combining several unique methodologies to provide clear, actionable signals across different market conditions. With its ability to analyze impulsive trend strength, volatility, and binary market direction, the RSI Pulsar offers a holistic view of the market that assists traders in identifying robust signals and rotational opportunities within a volatile market.
The integration of dynamic color coding further aids in quick visual assessments, allowing traders to adapt swiftly to changing market conditions, making the RSI Pulsar an essential component in the arsenal of modern traders aiming for precision and adaptability in their trading endeavors.
Legend
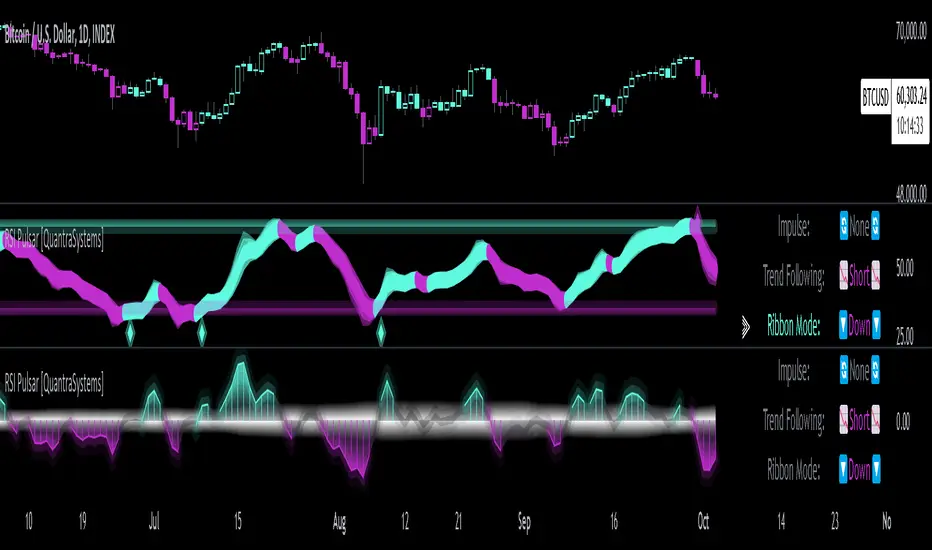
The RSI Pulsar encapsulates various modes tailored to diverse trading strategies. The different modes are the:
Impulse Mode:
- Focuses on strong outperformance, ideal for capturing movements in highly dynamic tokens.
Trend Following Mode:
- A classical perpetual trend-following approach and provides binary long and short signal classifications ideal for medium term swing trading.
Ribbon Mode:
- Offers quicker signals that are also binary in nature. Perfect for a confirmation signal when building higher frequency day trading systems.
Volatility Spectrum:
- This feature projects a visual 'cloud' representing volatility, which helps traders spot emerging trends and potential breakouts or reversals.
Compressed Mode:
- A condensed view that displays all signals in a clean and space-efficient manner. It provides a clear summary of market conditions, ideal for traders who prefer a simplified overview.
Methodology
The RSI Pulsar is built on a foundation of dynamic RSI analysis, where the traditional RSI is enhanced with advanced moving averages and standard deviation calculations. Each mode within the RSI Pulsar is designed to cater to specific aspects of the market's behavior, making it a versatile tool allowing traders to select different modes based on their trading style and market conditions.
Impulse Mode:
- This mode identifies strong outperformance in assets, making it ideal for asset rotation systems. It uses a combination of RSI thresholds and dynamic moving averages to pinpoint when an asset is not just trending positively, but doing so with significant strength.
- This is in contrast to typical usage of a base RSI, where elevated levels usually signal overbought and oversold periods. The RSI Pulsar flips this logic, where more extreme values are actually interpreted as a strong trend.
Trend Following Mode:
- Here, the RSI is compared to the midline (the default is level 50, but a dynamic midline can also be set), to determine the prevailing trend. This mode simplifies the trend-following process, providing clear bullish or bearish signals based on whether the RSI is above or below the midline - whether a fixed or dynamic level.
Ribbon Mode:
- This mode employs a series of calculated values derived from modified Heikin-Ashi smoothing to create a "ribbon" that smooths out price action and highlights underlying trends. The Ribbon Mode is particularly useful for traders who need quick confirmations of trend reversals or continuations.
Volatility Spectrum:
- The Volatility Spectrum takes a unique approach to measuring market volatility by analyzing the size and direction of Heikin-Ashi candles. This data is used to create a volatility cloud that helps traders identify when volatility is rising, falling, or neutral - allowing them to adjust their strategies accordingly.
- When the signal line breaks above the cloud, it signals increasing upwards volatility. When it breaks below it signifies increasing downwards volatility.
- This can be used to help identify strengthening and weakening trends, as well as imminent volatile periods, allowing traders to position themselves and adapt their strategies accordingly. This mode also works as a great volatility filter for shorter term day trading strategies. It is incredibly sensitive to volatility divergences, and can give additional insights to larger market turning points.
Compressed Mode:
- In Compressed Mode, all the signals from the various modes are displayed in a simplified format, making it easy for traders to quickly assess the market's overall condition without needing to delve into the details of each mode individually. Perfect for only viewing the exact data you need when live trading, or back testing.
Case Study I:
Utilizing ALMA Impulse Mode in High-Volatility Environments
- Here, the RSI Pulsar is configured with an RSI length of 9 and an ALMA length of 2 in Impulse Mode. The chart example shows how this setup can identify significant price movements, allowing traders to enter positions early and capture substantial price moves. Despite the fast settings resulting in occasional false signals, the indicator's ability to catch and ride out major trends more than compensates, making it highly effective in volatile environments.
- This configuration is suitable for traders seeking to trade quick, aggressive movements without enduring prolonged drawdowns. In Impulse Mode, the RSI Pulsar seeks strong trending zones, providing actionable signals that allow for timely entries and exits.
Case Study II:
SMMA Trend Following Mode for Ratio Analysis
- The RSI Pulsar in Trend Following mode, configured with the SMMA with default length settings. This setup is ideal for analyzing longer-term trends, particularly useful in cryptocurrency pairs or ratio charts, where it’s crucial to identify robust directional moves. The chart showcases strong trends in the Solana/Ethereum pair. The RSI Pulsar’s ability to smooth out price action while remaining responsive to trend changes makes it an excellent tool for capturing extended price moves.
- The image highlights how the RSI Pulsar efficiently tracks the strength of two tokens against each other, providing clear signals when one asset begins to outperform the other. Even in volatile markets, the SMMA ensures that the signals are reliable, filtering out noise and allowing traders to stay in the trend longer without being shaken out by minor corrections. This approach is particularly effective in ratio trading in order to inform a longer term swing trader of the strongest asset out of a customized pair.
Case Study III:
Monthly Analysis with RSI Pulsar in Ribbon Mode
- This case study demonstrates the versatility and reliability of the RSI Pulsar in Ribbon mode, applied to a monthly chart of Bitcoin with an RSI length of 8 and a TEMA length of 14. This setup highlights the indicator’s robustness across multiple timeframes, extending even to long-term analysis. The RSI Pulsar effectively smooths out noise while capturing significant trends, as seen during Bitcoin bull markets. The Ribbon mode provides a clear visual representation of momentum shifts, making it easier for traders to identify trend continuations and reversals with confidence.
Case Study IV:
Divergences and Continuations with the Volatility Spectrum
- Identifying harmony/divergences can be hit-or-miss at times, but this unique analysis method definitely has its merits at times. The RSI Pulsar, with its Volatility Spectrum feature, is used here to identify critical moments where price action either aligns with or diverges from the underlying volatility. As seen in the Bitcoin chart (using default settings), the indicator highlights areas where price trends either continue in harmony with volatility or diverge, signaling potential reversals. This method, while not always perfect, provides significant insight during key turning points in the market.
- The Volatility Spectrum's visual representation of rising and falling volatility, combined with divergence and harmony analysis, enables traders to anticipate significant shifts in market dynamics. In this case, multiple divergences correctly identified early trend reversals, while periods of harmony indicated strong trend continuations. While this method requires careful interpretation, especially during complex market conditions, it offers valuable signals that can be pivotal in making informed trading decisions, especially if combined with other forms of analysis it can form a critical component of an investing system.
สคริปต์แบบเฉพาะผู้ได้รับเชิญเท่านั้น
เฉพาะผู้ใช้งานที่ผู้เขียนอนุมัตเท่านั้นจึงจะสามารถเข้าถึงสคริปต์นี้ได้ คุณจะต้องขอและได้รับอนุญาตก่อนใช้งาน ซึ่งโดยทั่วไปจะได้รับอนุญาตหลังจากชำระเงินแล้ว สำหรับรายละเอียดเพิ่มเติม โปรดทำตามคำแนะนำของผู้เขียนด้านล่าง หรือติดต่อ Cryptosystems โดยตรง
TradingView ไม่แนะนำให้จ่ายเงินหรือใช้สคริปต์ เว้นแต่คุณจะเชื่อถือผู้เขียนและเข้าใจวิธีการทำงานของสคริปต์นั้นอย่างถ่องแท้ คุณยังสามารถหาทางเลือกแบบโอเพนซอร์สฟรีได้ใน สคริปต์ชุมชนของเรา
คำแนะนำของผู้เขียน
neither are any signals from us or our indicators.
Join the Cryptosystems Community (formerly QuantraSystems)👇
discord.gg/FMZDM3bZ9T
คำจำกัดสิทธิ์ความรับผิดชอบ
สคริปต์แบบเฉพาะผู้ได้รับเชิญเท่านั้น
เฉพาะผู้ใช้งานที่ผู้เขียนอนุมัตเท่านั้นจึงจะสามารถเข้าถึงสคริปต์นี้ได้ คุณจะต้องขอและได้รับอนุญาตก่อนใช้งาน ซึ่งโดยทั่วไปจะได้รับอนุญาตหลังจากชำระเงินแล้ว สำหรับรายละเอียดเพิ่มเติม โปรดทำตามคำแนะนำของผู้เขียนด้านล่าง หรือติดต่อ Cryptosystems โดยตรง
TradingView ไม่แนะนำให้จ่ายเงินหรือใช้สคริปต์ เว้นแต่คุณจะเชื่อถือผู้เขียนและเข้าใจวิธีการทำงานของสคริปต์นั้นอย่างถ่องแท้ คุณยังสามารถหาทางเลือกแบบโอเพนซอร์สฟรีได้ใน สคริปต์ชุมชนของเรา
คำแนะนำของผู้เขียน
neither are any signals from us or our indicators.
Join the Cryptosystems Community (formerly QuantraSystems)👇
discord.gg/FMZDM3bZ9T