OPEN-SOURCE SCRIPT
ที่อัปเดต: Force Index with Buy on Dip strategy
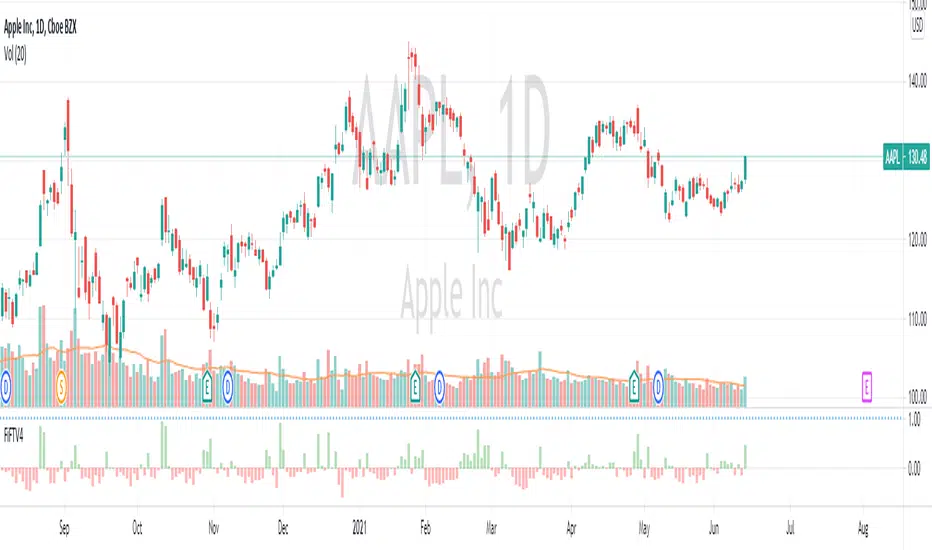
This charts has 2 indicators
1 - Force Index
This indicator is based on Dr Alexander Elder ForceIndex indicator with relate price to volume by multiplying net change and volume.
- GREEN Bar indicates Bull is in control
- RED Bar indicates Bear is in control.
LENGTH of the bar indicate the strength of Bull or Bear.
Normally there's potential BUY if the RED bar turned GREEN and SELL if GREEN to RED.
2 - Stochastic momentum
Stochastic momentum is to detect potential Reversal where BLUE bar will appear if :-
- Oversold - Stochastic less than 35
- Closing price is higher than last 2 High (Fast Turtle)
// Note : Best use with "EMA Indicators with BUY sell Signal"
เอกสารเผยแพร่
*****************************************************************************************Description :-
This indicator is based on Dr Alexander Elder ForceIndex indicator
with relate price to volume by multiplying net change and volume.
1 - GREEN Bar and GREEN background indicates Bull is in control
2 - RED Bar and RED background indicates Bear is in control.
LENGTH of the bar indicate the strength of Bull or Bear.
Normally there's potential BUY if the RED bar turned GREEN and SELL if GREEN to RED.
On top of that, it's also include information about Stochastic momentum to detect
potential Reversal. BLUE bar will appear if :-
1 - Oversold - Stochastic less than 35 (Default value set at 35)
2 - Closing price is higher than last 2 High
Note : Best use with "EMA Indicators with BUY sell Signal"
เอกสารเผยแพร่
New Update :-Change background color of the FiFT indicator to indicate BULL or BEAR force.
1 - GREEN Bar and GREEN background indicates Bull is in control
2 - RED Bar and RED background indicates Bear is in control.
LENGTH of the bar indicate the strength of Bull or Bear.
Normally there's potential BUY if the RED bar turned GREEN and SELL if GREEN to RED.
On top of that, it's also include information about Stochastic momentum to detect
potential Reversal. BLUE bar will appear if :-
1 - Oversold - Stochastic less than 35 (Default value set at 35)
2 - Closing price is higher than last 2 High
Note : Best use with "EMA Indicators with BUY sell Signal"
เอกสารเผยแพร่
Remove Star from -ve FiFT BOD signal. เอกสารเผยแพร่
Bug fix : FiFT change with different candle type.Standardize signal to avoid confusion : OB = Overbought, OS = Oversold.
เอกสารเผยแพร่
Code Clean upเอกสารเผยแพร่
Simplify the code to focus on volume only instead of integrating Volume and Pirceสคริปต์โอเพนซอร์ซ
ด้วยเจตนารมณ์หลักของ TradingView ผู้สร้างสคริปต์นี้ได้ทำให้เป็นโอเพนซอร์ส เพื่อให้เทรดเดอร์สามารถตรวจสอบและยืนยันฟังก์ชันการทำงานของมันได้ ขอชื่นชมผู้เขียน! แม้ว่าคุณจะใช้งานได้ฟรี แต่โปรดจำไว้ว่าการเผยแพร่โค้ดซ้ำจะต้องเป็นไปตาม กฎระเบียบการใช้งาน ของเรา
Contact me to learn Turtle Trading System, MCDX and other indicators (t.me/SgxFx)
tradingview.com/script/mbiUr95n-MCDX-Plus/
tradingview.com/script/mcAidXIT-FiFT-Pro/
tradingview.com/script/viAR3Ilo-Trend-Sign
tradingview.com/script/mbiUr95n-MCDX-Plus/
tradingview.com/script/mcAidXIT-FiFT-Pro/
tradingview.com/script/viAR3Ilo-Trend-Sign
คำจำกัดสิทธิ์ความรับผิดชอบ
ข้อมูลและบทความไม่ได้มีวัตถุประสงค์เพื่อก่อให้เกิดกิจกรรมทางการเงิน, การลงทุน, การซื้อขาย, ข้อเสนอแนะ หรือคำแนะนำประเภทอื่น ๆ ที่ให้หรือรับรองโดย TradingView อ่านเพิ่มเติมใน ข้อกำหนดการใช้งาน
สคริปต์โอเพนซอร์ซ
ด้วยเจตนารมณ์หลักของ TradingView ผู้สร้างสคริปต์นี้ได้ทำให้เป็นโอเพนซอร์ส เพื่อให้เทรดเดอร์สามารถตรวจสอบและยืนยันฟังก์ชันการทำงานของมันได้ ขอชื่นชมผู้เขียน! แม้ว่าคุณจะใช้งานได้ฟรี แต่โปรดจำไว้ว่าการเผยแพร่โค้ดซ้ำจะต้องเป็นไปตาม กฎระเบียบการใช้งาน ของเรา
Contact me to learn Turtle Trading System, MCDX and other indicators (t.me/SgxFx)
tradingview.com/script/mbiUr95n-MCDX-Plus/
tradingview.com/script/mcAidXIT-FiFT-Pro/
tradingview.com/script/viAR3Ilo-Trend-Sign
tradingview.com/script/mbiUr95n-MCDX-Plus/
tradingview.com/script/mcAidXIT-FiFT-Pro/
tradingview.com/script/viAR3Ilo-Trend-Sign
คำจำกัดสิทธิ์ความรับผิดชอบ
ข้อมูลและบทความไม่ได้มีวัตถุประสงค์เพื่อก่อให้เกิดกิจกรรมทางการเงิน, การลงทุน, การซื้อขาย, ข้อเสนอแนะ หรือคำแนะนำประเภทอื่น ๆ ที่ให้หรือรับรองโดย TradingView อ่านเพิ่มเติมใน ข้อกำหนดการใช้งาน