OPEN-SOURCE SCRIPT
ที่อัปเดต: Volume Spike Alert
Indicator Features:
📊 Core Functionalities:
Exceptional Volume Detection:
Calculates volume in USD (volume × price)
Compares it against a 90-day average (3 months)
Configurable from 1 to 252 days
Visual Signals:
Green labels for bullish candles with high volume
Red labels for bearish candles with high volume
Displays excess percentage (e.g., +45.2%)
Dual Alert System:
AlertCondition: For manual alert configuration in TradingView
Alert(): Automated alerts with detailed information
⚙️ Available Settings:
Average Period: 1–252 days (default: 90 days)
Enable/Disable Alerts: Configurable checkbox
Show/Hide Labels: Visual control
Label Size: Tiny, Small, Normal, Large
Minimum Threshold: Minimum percentage required to trigger a signal
📋 Displayed Information:
On Labels:
Excess percentage (e.g., +67.3%)
Color based on candle direction
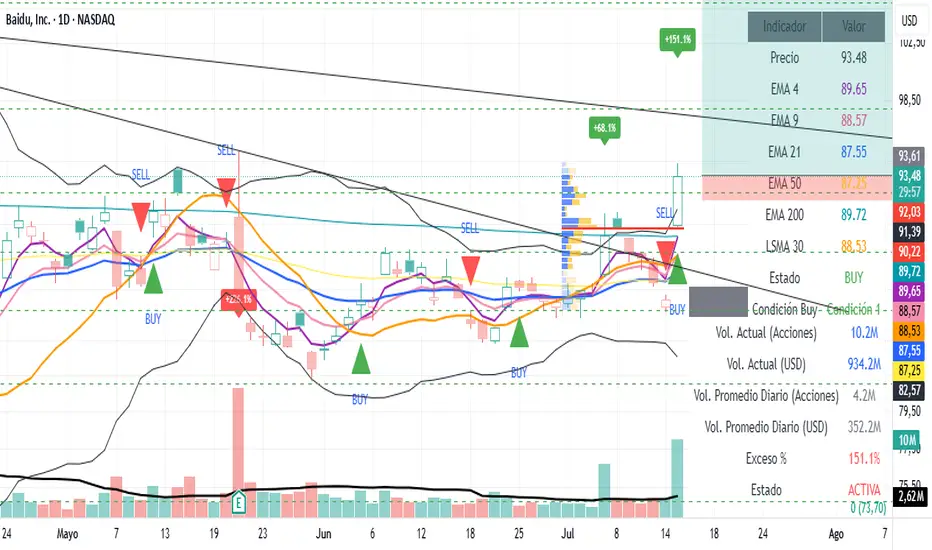
In the Table:
Current volume in millions USD
Average volume in millions USD
Excess percentage
Alert status (ACTIVE/NORMAL)
Calculation period
In Alerts:
Candle type (BULLISH 🟢 / BEARISH 🔴)
Symbol and current price
Current volume vs. average
Timeframe used
📊 Core Functionalities:
Exceptional Volume Detection:
Calculates volume in USD (volume × price)
Compares it against a 90-day average (3 months)
Configurable from 1 to 252 days
Visual Signals:
Green labels for bullish candles with high volume
Red labels for bearish candles with high volume
Displays excess percentage (e.g., +45.2%)
Dual Alert System:
AlertCondition: For manual alert configuration in TradingView
Alert(): Automated alerts with detailed information
⚙️ Available Settings:
Average Period: 1–252 days (default: 90 days)
Enable/Disable Alerts: Configurable checkbox
Show/Hide Labels: Visual control
Label Size: Tiny, Small, Normal, Large
Minimum Threshold: Minimum percentage required to trigger a signal
📋 Displayed Information:
On Labels:
Excess percentage (e.g., +67.3%)
Color based on candle direction
In the Table:
Current volume in millions USD
Average volume in millions USD
Excess percentage
Alert status (ACTIVE/NORMAL)
Calculation period
In Alerts:
Candle type (BULLISH 🟢 / BEARISH 🔴)
Symbol and current price
Current volume vs. average
Timeframe used
เอกสารเผยแพร่
Updated code to show not only the amounts of stocks but the amount of USD for the volumen in different frecuencies.สคริปต์โอเพนซอร์ซ
ด้วยเจตนารมณ์หลักของ TradingView ผู้สร้างสคริปต์นี้ได้ทำให้เป็นโอเพนซอร์ส เพื่อให้เทรดเดอร์สามารถตรวจสอบและยืนยันฟังก์ชันการทำงานของมันได้ ขอชื่นชมผู้เขียน! แม้ว่าคุณจะใช้งานได้ฟรี แต่โปรดจำไว้ว่าการเผยแพร่โค้ดซ้ำจะต้องเป็นไปตาม กฎระเบียบการใช้งาน ของเรา
คำจำกัดสิทธิ์ความรับผิดชอบ
ข้อมูลและบทความไม่ได้มีวัตถุประสงค์เพื่อก่อให้เกิดกิจกรรมทางการเงิน, การลงทุน, การซื้อขาย, ข้อเสนอแนะ หรือคำแนะนำประเภทอื่น ๆ ที่ให้หรือรับรองโดย TradingView อ่านเพิ่มเติมใน ข้อกำหนดการใช้งาน
สคริปต์โอเพนซอร์ซ
ด้วยเจตนารมณ์หลักของ TradingView ผู้สร้างสคริปต์นี้ได้ทำให้เป็นโอเพนซอร์ส เพื่อให้เทรดเดอร์สามารถตรวจสอบและยืนยันฟังก์ชันการทำงานของมันได้ ขอชื่นชมผู้เขียน! แม้ว่าคุณจะใช้งานได้ฟรี แต่โปรดจำไว้ว่าการเผยแพร่โค้ดซ้ำจะต้องเป็นไปตาม กฎระเบียบการใช้งาน ของเรา
คำจำกัดสิทธิ์ความรับผิดชอบ
ข้อมูลและบทความไม่ได้มีวัตถุประสงค์เพื่อก่อให้เกิดกิจกรรมทางการเงิน, การลงทุน, การซื้อขาย, ข้อเสนอแนะ หรือคำแนะนำประเภทอื่น ๆ ที่ให้หรือรับรองโดย TradingView อ่านเพิ่มเติมใน ข้อกำหนดการใช้งาน