OPEN-SOURCE SCRIPT
ที่อัปเดต: Multi Candle Body Mapper
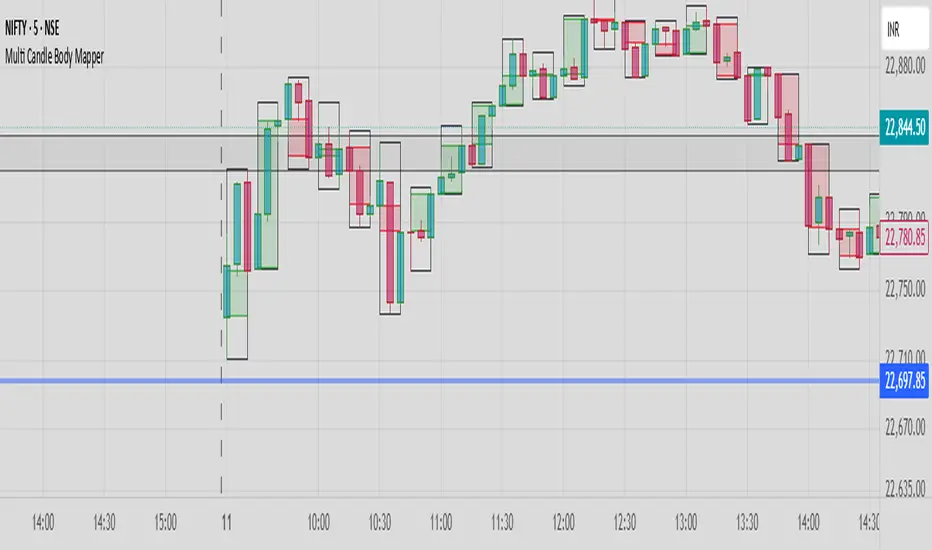
Multi Candle Body Mapper
Visualize higher-timeframe candle structure within lower timeframes — without switching charts.
This tool maps grouped candle bodies and wicks (e.g., 15min candles on a 5min chart) using precise boxes and lines. Ideal for intraday traders who want to analyze market intent, body bias, and wick rejection in a compressed, organized view.
Features:
Visualize 3, 6, or 12 candle groups (e.g., 15min / 30min / 1H views)
Body box shows bullish/bearish color with adjustable transparency
Wick box shows high-low range with adjustable thickness and color
Dashed line at group close level for market direction hint
Full color customization
Toggle individual elements ON/OFF
Clean overlay – doesn’t interfere with price candles
Great for spotting:
Hidden support/resistance
Momentum buildup
Reversal traps and continuation setups
Keep your chart simple but smarter — all without changing your timeframe.
เอกสารเผยแพร่
Multi Candle Body MapperVisualize higher-timeframe candle structure within lower timeframes — without switching charts.
This tool maps grouped candle bodies and wicks (e.g., 15min candles on a 5min chart) using precise boxes and lines. Ideal for intraday traders who want to analyze market intent, body bias, and wick rejection in a compressed, organized view.
Features:
Visualize 3, 6, or 12 candle groups (e.g., 15min / 30min / 1H views)
Body box shows bullish/bearish color with adjustable transparency
Wick box shows high-low range with adjustable thickness and color
Dashed line at group close level for market direction hint
Full color customization
Toggle individual elements ON/OFF
Clean overlay – doesn’t interfere with price candles
Great for spotting:
Hidden support/resistance
Momentum buildup
Reversal traps and continuation setups
Keep your chart simple but smarter — all without changing your timeframe.
สคริปต์โอเพนซอร์ซ
ด้วยเจตนารมณ์หลักของ TradingView ผู้สร้างสคริปต์นี้ได้ทำให้เป็นโอเพนซอร์ส เพื่อให้เทรดเดอร์สามารถตรวจสอบและยืนยันฟังก์ชันการทำงานของมันได้ ขอชื่นชมผู้เขียน! แม้ว่าคุณจะใช้งานได้ฟรี แต่โปรดจำไว้ว่าการเผยแพร่โค้ดซ้ำจะต้องเป็นไปตาม กฎระเบียบการใช้งาน ของเรา
คำจำกัดสิทธิ์ความรับผิดชอบ
ข้อมูลและบทความไม่ได้มีวัตถุประสงค์เพื่อก่อให้เกิดกิจกรรมทางการเงิน, การลงทุน, การซื้อขาย, ข้อเสนอแนะ หรือคำแนะนำประเภทอื่น ๆ ที่ให้หรือรับรองโดย TradingView อ่านเพิ่มเติมใน ข้อกำหนดการใช้งาน