OPEN-SOURCE SCRIPT
ที่อัปเดต: Futures Correlation Visualizer

OVERVIEW
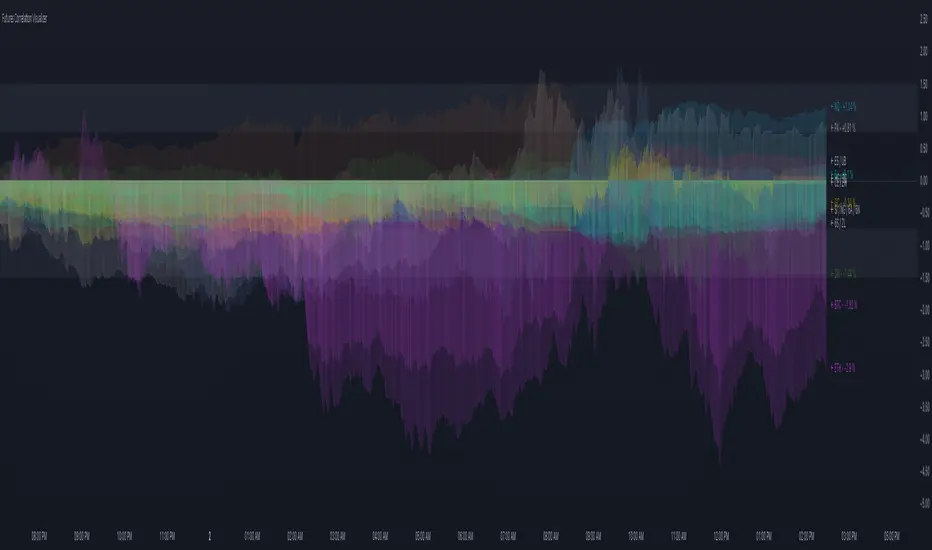
This indicator plots the normalized price changes of commonly traded futures. Visualizing data in this way makes studying and understanding market participation and sentiment easier.
Note:
Only 20 symbols can be plotted. The "request" functions are limited to 40 calls, 1 timeframe counts as a call, and 2 timeframes are used per symbol. Normalized values are derived by dividing the charts timeframe by 1D data. A runtime error will occur when more than 20 symbols are enabled. This limitation is unavoidable.
INPUTS
You can configure:
- Colors and color scheme
- Symbols to plot (most common futures)
- Norm. source (todays open / yesterdays close)
- Measurement type (%, ‱, Δ)
- Label, zone, and zero options
เอกสารเผยแพร่
- Added link to indicator page the top of the code.
- Updated chart
เอกสารเผยแพร่
- Minor code changes.
- Added "Smooth" option for color transitions.
- Converted to Pine Script v6
เอกสารเผยแพร่
- Updated script to align with Pine Script changes: Pine Script recently updated when loop boundaries were checked. Previously, the boundary was established before iterating. Now, the boundary is evaluated on each iteration.
เอกสารเผยแพร่
- Improved logic to be more reliable after partial trading days.
สคริปต์โอเพนซอร์ซ
ด้วยเจตนารมณ์หลักของ TradingView ผู้สร้างสคริปต์นี้ได้ทำให้เป็นโอเพนซอร์ส เพื่อให้เทรดเดอร์สามารถตรวจสอบและยืนยันฟังก์ชันการทำงานของมันได้ ขอชื่นชมผู้เขียน! แม้ว่าคุณจะใช้งานได้ฟรี แต่โปรดจำไว้ว่าการเผยแพร่โค้ดซ้ำจะต้องเป็นไปตาม กฎระเบียบการใช้งาน ของเรา
Discord: discord.gg/bPAPhwUeud
Website: liquid-trader.com
Website: liquid-trader.com
คำจำกัดสิทธิ์ความรับผิดชอบ
ข้อมูลและบทความไม่ได้มีวัตถุประสงค์เพื่อก่อให้เกิดกิจกรรมทางการเงิน, การลงทุน, การซื้อขาย, ข้อเสนอแนะ หรือคำแนะนำประเภทอื่น ๆ ที่ให้หรือรับรองโดย TradingView อ่านเพิ่มเติมใน ข้อกำหนดการใช้งาน