PROTECTED SOURCE SCRIPT
ที่อัปเดต: Candles

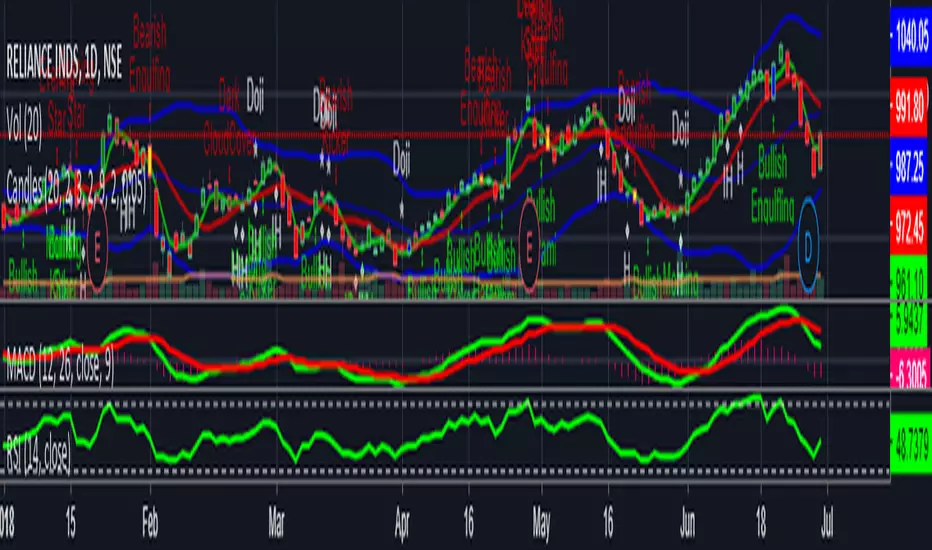
The default script has: Bolinger Bands, Moving Average and Doji , Bearish Harami, Bullish Harami, Bearish Engulfing , Bullish Engulfing , Piercing Line, Bullish Belt, Bullish Kicker, and Bearish Kicker. The Piercing Line, Bullish Belt, and the Kickers will usually show up better in the daily charts.
Please note if moving average SMA (green line) crosses above SMA (red line) is uptrend , stock price will move up gradually. If suppose moving average SMA (green line) crosses below SMA(red line) is downtrend, stock price will move down. Also please validate with MACD & RSI for reference will get more clarity.
Please note if moving average SMA (green line) crosses above SMA (red line) is uptrend , stock price will move up gradually. If suppose moving average SMA (green line) crosses below SMA(red line) is downtrend, stock price will move down. Also please validate with MACD & RSI for reference will get more clarity.
เอกสารเผยแพร่
Ichamoku Cloud indicator addedเอกสารเผยแพร่
#Update with Support and ResistanceSupport--> Orange Colour
Resistance--> Aqua Colour
เอกสารเผยแพร่
#update with support and resistance colourssupport in yellow colour
resistance in aqua colour
สคริปต์ที่ได้รับการป้องกัน
สคริปต์นี้ถูกเผยแพร่เป็นแบบ closed-source อย่างไรก็ตาม คุณสามารถใช้ได้อย่างอิสระและไม่มีข้อจำกัดใดๆ – เรียนรู้เพิ่มเติมได้ที่นี่
คำจำกัดสิทธิ์ความรับผิดชอบ
ข้อมูลและบทความไม่ได้มีวัตถุประสงค์เพื่อก่อให้เกิดกิจกรรมทางการเงิน, การลงทุน, การซื้อขาย, ข้อเสนอแนะ หรือคำแนะนำประเภทอื่น ๆ ที่ให้หรือรับรองโดย TradingView อ่านเพิ่มเติมใน ข้อกำหนดการใช้งาน