OPEN-SOURCE SCRIPT
ที่อัปเดต: Bulls vs Bears
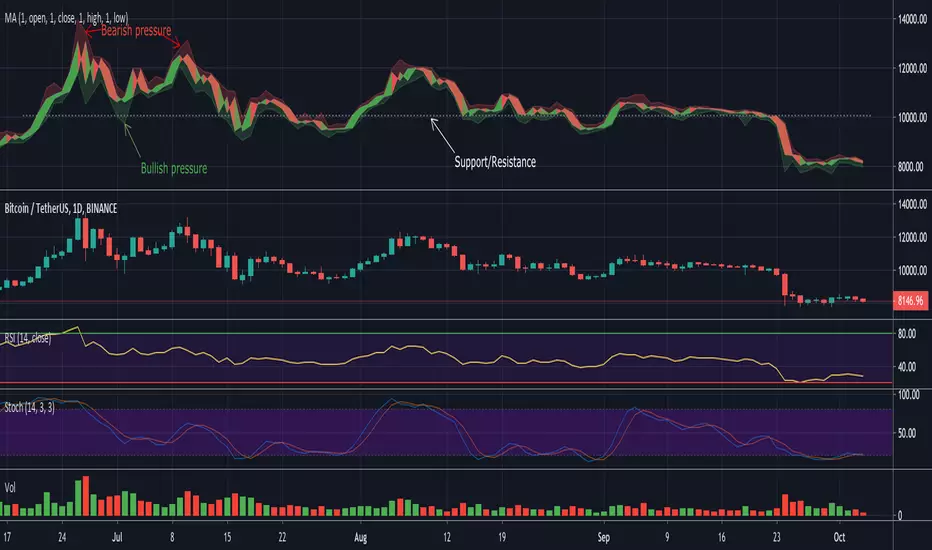
A tool with the purpose for better insight of bulls/bears influence.
The center, more bright part are the open-close prices, filled green if bullish, red if bearish.
The transparent red and green part, above and below, are the "wick/shadow" area's.
If for example the bears push the price down, far under the open, but the bulls push it right back, so you'll have a large wick,
this will be visible as a large transparent green area below the brighter open-close center area.
Hope this helps!
เอกสารเผยแพร่
Also it might help to find certain support/resistance regions (more towards the open/close prices),it also can give a more clear imagine when the open and close prices are tight together.
I believe it even can bring more insights and more details regarding divergences.
สคริปต์โอเพนซอร์ซ
ด้วยเจตนารมณ์หลักของ TradingView ผู้สร้างสคริปต์นี้ได้ทำให้เป็นโอเพนซอร์ส เพื่อให้เทรดเดอร์สามารถตรวจสอบและยืนยันฟังก์ชันการทำงานของมันได้ ขอชื่นชมผู้เขียน! แม้ว่าคุณจะใช้งานได้ฟรี แต่โปรดจำไว้ว่าการเผยแพร่โค้ดซ้ำจะต้องเป็นไปตาม กฎระเบียบการใช้งาน ของเรา
Who are PineCoders?
tradingview.com/chart/SSP/yW5eOqtm-Who-are-PineCoders/
TG Pine Script® Q&A: t.me/PineCodersQA
- We cannot control our emotions,
but we can control our keyboard -
tradingview.com/chart/SSP/yW5eOqtm-Who-are-PineCoders/
TG Pine Script® Q&A: t.me/PineCodersQA
- We cannot control our emotions,
but we can control our keyboard -
คำจำกัดสิทธิ์ความรับผิดชอบ
ข้อมูลและบทความไม่ได้มีวัตถุประสงค์เพื่อก่อให้เกิดกิจกรรมทางการเงิน, การลงทุน, การซื้อขาย, ข้อเสนอแนะ หรือคำแนะนำประเภทอื่น ๆ ที่ให้หรือรับรองโดย TradingView อ่านเพิ่มเติมใน ข้อกำหนดการใช้งาน