RSI-2
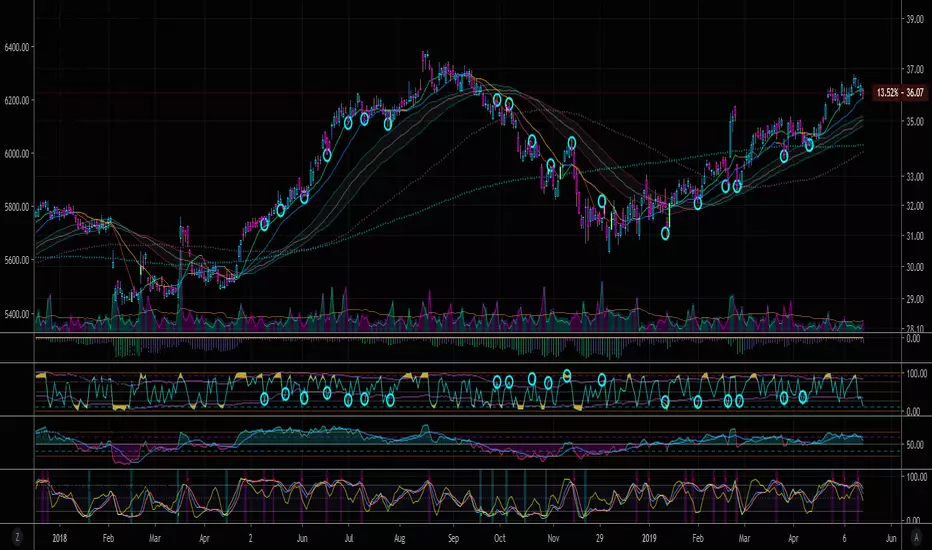
It is used to locate pull back points within a major trend.
These points will generally offer the best risk/reward entry areas.
OB is >90
OS is <10
In an uptrend, long, when RSI-2 is OS
In a downtrend, short, when RSI-2 is OB
Start with 1D chart,
If RSI-2 gives too many signals (false signals) then use higher time frame, such as 3D
If RSi-2 gives not enough signals, then use a lower time frame, such as 3HR
For more information on RSI-2, read "Short term trading strategies that work"-by larry connors, chapter 9
Bollinger bands activated, to fix the prior issue where RSI-2 indicator was not sensitive enough on the current time frame to reach OS (<10) & OB (>90) areas.
With the bolinger bands, it effectively creates a corridor channel to use as OB & OS.
Bolinger band for RSI-2 uses 1 std dev over 31 periods.
traditional bolinger bands are based on: 2 std dev over 20 period ,
tradition TDI is based on: 1.618 std dev over 31 peroids
สคริปต์แบบเฉพาะผู้ได้รับเชิญเท่านั้น
เฉพาะผู้ใช้งานที่ผู้เขียนอนุมัตเท่านั้นจึงจะสามารถเข้าถึงสคริปต์นี้ได้ คุณจะต้องขอและได้รับอนุญาตก่อนใช้งาน ซึ่งโดยทั่วไปจะได้รับอนุญาตหลังจากชำระเงินแล้ว สำหรับรายละเอียดเพิ่มเติม โปรดทำตามคำแนะนำของผู้เขียนด้านล่าง หรือติดต่อ provalesco โดยตรง
TradingView ไม่แนะนำให้จ่ายเงินหรือใช้สคริปต์ เว้นแต่คุณจะเชื่อถือผู้เขียนและเข้าใจวิธีการทำงานของสคริปต์นั้นอย่างถ่องแท้ คุณยังสามารถหาทางเลือกแบบโอเพนซอร์สฟรีได้ใน สคริปต์ชุมชนของเรา
คำแนะนำของผู้เขียน
คำจำกัดสิทธิ์ความรับผิดชอบ
สคริปต์แบบเฉพาะผู้ได้รับเชิญเท่านั้น
เฉพาะผู้ใช้งานที่ผู้เขียนอนุมัตเท่านั้นจึงจะสามารถเข้าถึงสคริปต์นี้ได้ คุณจะต้องขอและได้รับอนุญาตก่อนใช้งาน ซึ่งโดยทั่วไปจะได้รับอนุญาตหลังจากชำระเงินแล้ว สำหรับรายละเอียดเพิ่มเติม โปรดทำตามคำแนะนำของผู้เขียนด้านล่าง หรือติดต่อ provalesco โดยตรง
TradingView ไม่แนะนำให้จ่ายเงินหรือใช้สคริปต์ เว้นแต่คุณจะเชื่อถือผู้เขียนและเข้าใจวิธีการทำงานของสคริปต์นั้นอย่างถ่องแท้ คุณยังสามารถหาทางเลือกแบบโอเพนซอร์สฟรีได้ใน สคริปต์ชุมชนของเรา