OPEN-SOURCE SCRIPT
Slope Indicator of Highest Highs and Lowest Lows
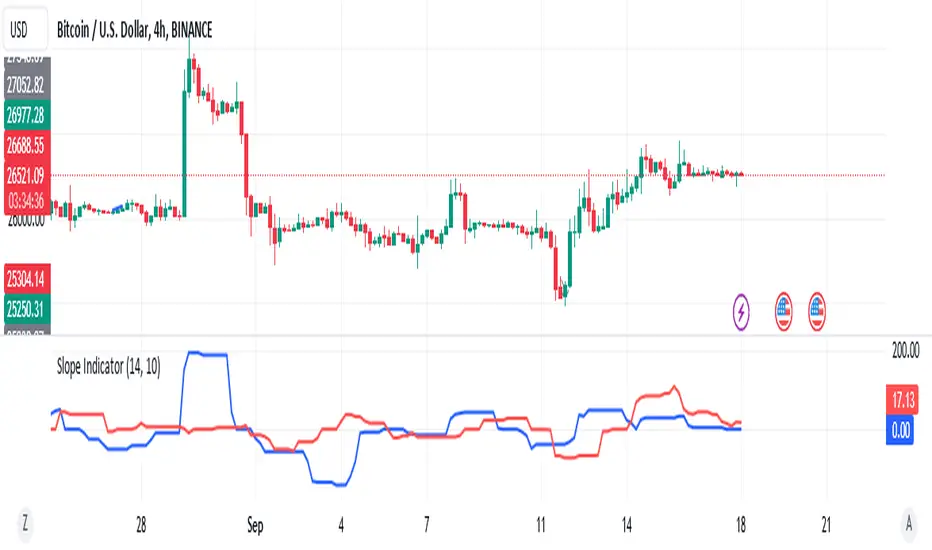
In this example, the indicator calculates the slope between the highest high value of the current period and the highest high value candles bars ago. The result is plotted on the chart as a line.
And this example calculates the slope between the lowest low value of the current period and the lowest low value candles bars ago. It then plots the slope on the chart using a red line.
Feel free to adjust the input parameters and modify the code to fit your specific requirements. If you have any more questions or need further assistance, feel free to ask!
สคริปต์โอเพนซอร์ซ
ด้วยเจตนารมณ์หลักของ TradingView ผู้สร้างสคริปต์นี้ได้ทำให้เป็นโอเพนซอร์ส เพื่อให้เทรดเดอร์สามารถตรวจสอบและยืนยันฟังก์ชันการทำงานของมันได้ ขอชื่นชมผู้เขียน! แม้ว่าคุณจะใช้งานได้ฟรี แต่โปรดจำไว้ว่าการเผยแพร่โค้ดซ้ำจะต้องเป็นไปตาม กฎระเบียบการใช้งาน ของเรา
คำจำกัดสิทธิ์ความรับผิดชอบ
ข้อมูลและบทความไม่ได้มีวัตถุประสงค์เพื่อก่อให้เกิดกิจกรรมทางการเงิน, การลงทุน, การซื้อขาย, ข้อเสนอแนะ หรือคำแนะนำประเภทอื่น ๆ ที่ให้หรือรับรองโดย TradingView อ่านเพิ่มเติมใน ข้อกำหนดการใช้งาน