PROTECTED SOURCE SCRIPT
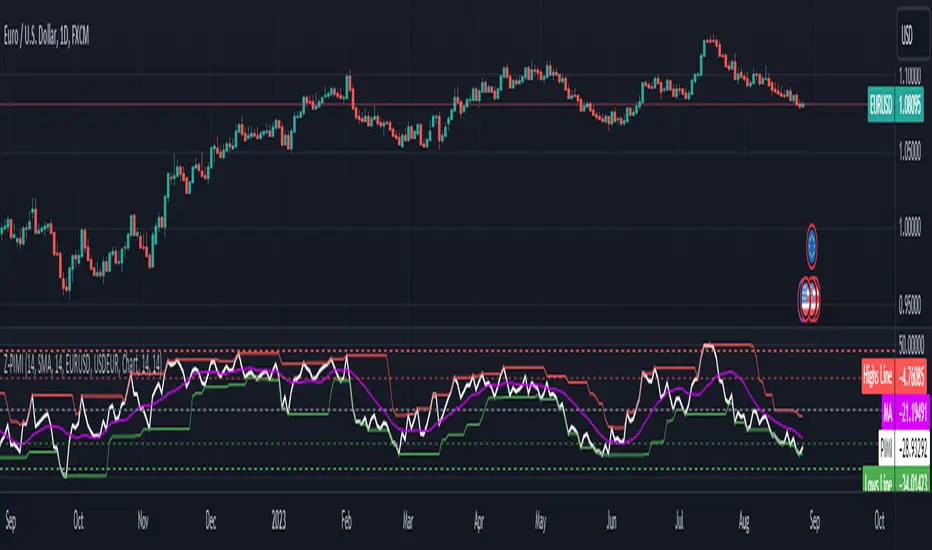
Zaree - Predictive Imparity Momentum Indicator

The "Zaree - Predictive Imparity Momentum Indicator" (Z-PIMI) is a custom indicator designed to measure the momentum difference between two currency pairs. Let's break down its components and functionality:
Inputs:
pimiLength: Defines the period for the RSI calculation.
selectedMAType: Allows the user to choose the type of moving average (SMA, EMA, WMA, VWMA) they want to apply to the PIMI.
maLength: Defines the period for the chosen moving average.
baseCurrency & quoteCurrency: These are the two currency pairs that the user wants to compare.
Timeframe Selection:
The user can select a specific timeframe for the analysis, or they can use the chart's current timeframe.
Calculation of Currency Indices:
The closing prices of the Base Currency and Quote Currency are fetched for the selected timeframe.
The RSI (Relative Strength Index) is calculated for both currencies using the pimiLength.
The PIMI is then calculated by subtracting the RSI of the Quote Currency from the RSI of the Base Currency.
Moving Average Calculation:
A moving average of the PIMI is calculated based on the user's selected type (selectedMAType) and period (maLength).
Style Settings:
These are hardcoded values that define the levels for the upper and lower bands. These bands can help identify overbought or oversold conditions.
Highs and Lows Calculation:
The highest and lowest values of the PIMI over specified periods (highsLength and lowsLength) are calculated. These can help identify extreme values or turning points.
Plotting:
The PIMI is plotted as a white line.
The moving average of the PIMI is plotted as a purple line.
The upper and lower bands are plotted as horizontal lines at specified levels.
The highest and lowest values of the PIMI are plotted as red and green lines, respectively.
Interpretation:
The PIMI provides a measure of the momentum difference between two currency pairs. When the PIMI is rising, it indicates that the Base Currency is gaining momentum relative to the Quote Currency, and vice versa.
The moving average can be used as a signal line. For instance, when the PIMI crosses above its moving average, it might be considered a bullish signal, and when it crosses below, it might be considered bearish.
The upper and lower bands, as well as the highs and lows lines, can help identify overbought or oversold conditions. For example, if the PIMI reaches or exceeds the upper band, it might indicate overbought conditions, suggesting a potential reversal or pullback.
Overall, the Z-PIMI offers a tool to compare the momentum of two currency pairs and identify potential trading opportunities based on their relative strength and established thresholds.
สคริปต์ที่ได้รับการป้องกัน
สคริปต์นี้ถูกเผยแพร่เป็นแบบ closed-source อย่างไรก็ตาม คุณสามารถใช้ได้อย่างอิสระและไม่มีข้อจำกัดใดๆ – เรียนรู้เพิ่มเติมได้ที่นี่
คำจำกัดสิทธิ์ความรับผิดชอบ
ข้อมูลและบทความไม่ได้มีวัตถุประสงค์เพื่อก่อให้เกิดกิจกรรมทางการเงิน, การลงทุน, การซื้อขาย, ข้อเสนอแนะ หรือคำแนะนำประเภทอื่น ๆ ที่ให้หรือรับรองโดย TradingView อ่านเพิ่มเติมใน ข้อกำหนดการใช้งาน