OPEN-SOURCE SCRIPT
ที่อัปเดต: M2 Global Liquidity Index - X Days Lead

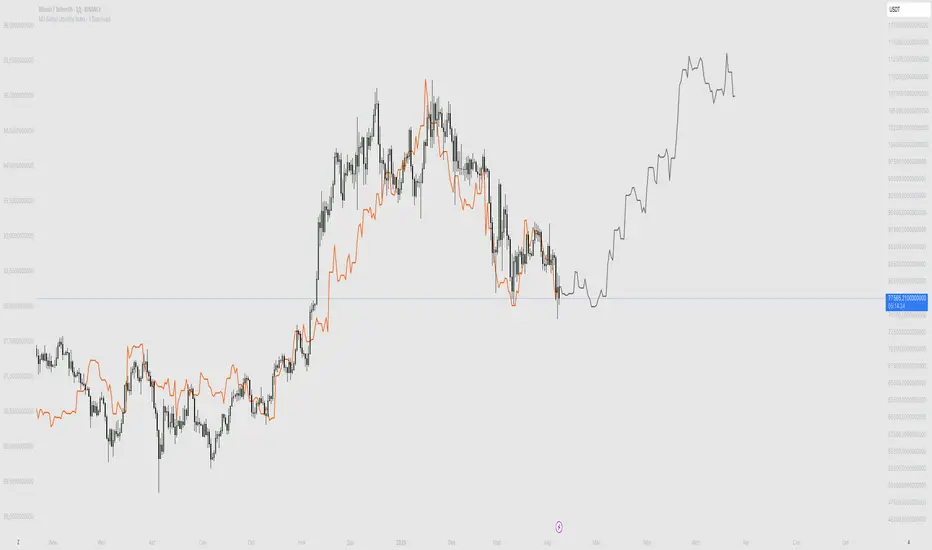
This custom indicator overlays the Bitcoin price chart with the Global Liquidity M2 chart, providing a unique perspective on how monetary supply might influence Bitcoin's price movements. The indicator distinguishes between past and future segments of the liquidity data using two distinct colors.
- Past Segment: The portion of the Global Liquidity M2 chart that has already passed is displayed in one color, allowing users to assess historical correlations with Bitcoin's price.
- Future Segment: The upcoming part of the liquidity chart is shown in a different color, offering insights into potential future impacts on Bitcoin's price trajectory.
by walkin
เอกสารเผยแพร่
This custom indicator overlays the Bitcoin price chart with the Global Liquidity M2 chart, providing a unique perspective on how monetary supply might influence Bitcoin's price movements. The indicator distinguishes between past and future segments of the liquidity data using two distinct colors.- Past Segment: The portion of the Global Liquidity M2 chart that has already passed is displayed in one color, allowing users to assess historical correlations with Bitcoin's price.
- Future Segment: The upcoming part of the liquidity chart is shown in a different color, offering insights into potential future impacts on Bitcoin's price trajectory.
by walkin
สคริปต์โอเพนซอร์ซ
ด้วยเจตนารมณ์หลักของ TradingView ผู้สร้างสคริปต์นี้ได้ทำให้เป็นโอเพนซอร์ส เพื่อให้เทรดเดอร์สามารถตรวจสอบและยืนยันฟังก์ชันการทำงานของมันได้ ขอชื่นชมผู้เขียน! แม้ว่าคุณจะใช้งานได้ฟรี แต่โปรดจำไว้ว่าการเผยแพร่โค้ดซ้ำจะต้องเป็นไปตาม กฎระเบียบการใช้งาน ของเรา
คำจำกัดสิทธิ์ความรับผิดชอบ
ข้อมูลและบทความไม่ได้มีวัตถุประสงค์เพื่อก่อให้เกิดกิจกรรมทางการเงิน, การลงทุน, การซื้อขาย, ข้อเสนอแนะ หรือคำแนะนำประเภทอื่น ๆ ที่ให้หรือรับรองโดย TradingView อ่านเพิ่มเติมใน ข้อกำหนดการใช้งาน