OPEN-SOURCE SCRIPT
ที่อัปเดต: EMA Oracle and RSI
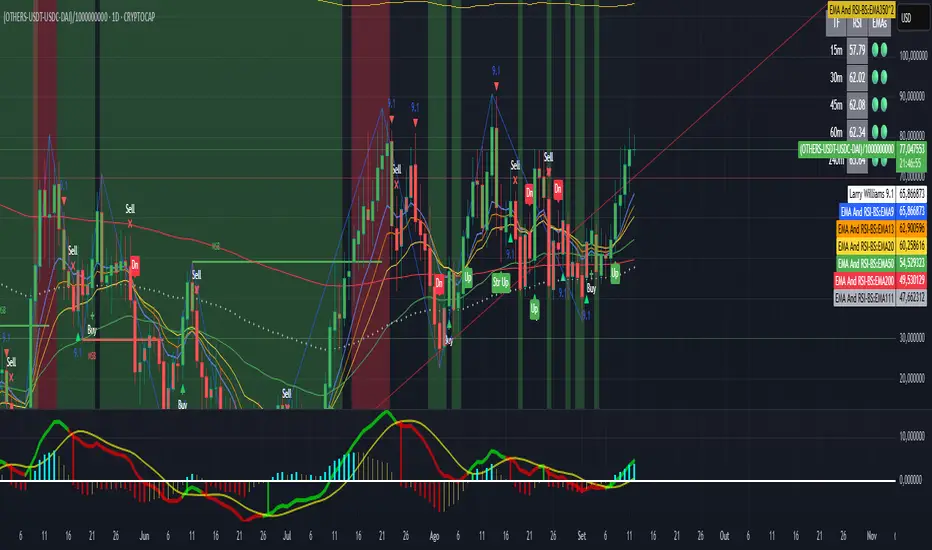
EMA Oracle
- “See the market’s structure through the eyes of exponential wisdom.”
combines classic EMA stacks with Pi-based logic to reveal high-probability buy/sell zones and trend bias across timeframes
Multi-EMA Trend & Pi Signal Indicator
This advanced indicator combines classic trend analysis with Pi-based signal logic to help traders identify optimal entry and exit zones across multiple timeframes.
Core Features
EMA Trend Structure: Displays EMAs 9, 13, 20, 50, and 200 to visualize short-term and long-term trend orientation. Bullish momentum is indicated when shorter EMAs are stacked above longer ones.
Pi-Based Signal Logic: Inspired by the Pi Indicator, it includes EMA111 and EMA700 (350×2) on the daily chart:
Buy Zone: When price is trading below EMA111, it signals potential accumulation for spot or low-leverage position trades.
Sell Zone: When price is above EMA700, it suggests potential distribution or exit zones.
Trend Cross Alerts: Detects EMA crossovers and crossunders to highlight shifts in market structure and generate buy/sell signals.
Multi-Timeframe Analysis: Evaluates trend direction across selected timeframes (e.g., 15m, 30m, 1h, 4h, 1D), offering a broader market perspective.
RSI Integration: Combines Relative Strength Index (RSI) readings with EMA positioning to assess momentum and overbought/oversold conditions.
Trend Table Display: A dynamic table summarizes the asset’s trend status per timeframe, showing:
RSI values
EMA alignment
Overall trend bias (bullish, bearish, neutral)
เอกสารเผยแพร่
EMA Oracle*** Did a small change to correct the indicator of tendency on the table that is shown on the up right.
- “See the market’s structure through the eyes of exponential wisdom.”
combines classic EMA stacks with Pi-based logic to reveal high-probability buy/sell zones and trend bias across timeframes
Multi-EMA Trend & Pi Signal Indicator
This advanced indicator combines classic trend analysis with Pi-based signal logic to help traders identify optimal entry and exit zones across multiple timeframes.
Core Features
EMA Trend Structure: Displays EMAs 9, 13, 20, 50, and 200 to visualize short-term and long-term trend orientation. Bullish momentum is indicated when shorter EMAs are stacked above longer ones.
Pi-Based Signal Logic: Inspired by the Pi Indicator, it includes EMA111 and EMA700 (350×2) on the daily chart:
Buy Zone: When price is trading below EMA111, it signals potential accumulation for spot or low-leverage position trades.
Sell Zone: When price is above EMA700, it suggests potential distribution or exit zones.
Trend Cross Alerts: Detects EMA crossovers and crossunders to highlight shifts in market structure and generate buy/sell signals.
Multi-Timeframe Analysis: Evaluates trend direction across selected timeframes (e.g., 15m, 30m, 1h, 4h, 1D), offering a broader market perspective.
RSI Integration: Combines Relative Strength Index (RSI) readings with EMA positioning to assess momentum and overbought/oversold conditions.
Trend Table Display: A dynamic table summarizes the asset’s trend status per timeframe, showing:
RSI values
EMA alignment
Overall trend bias (bullish, bearish, neutral)
เอกสารเผยแพร่
Made a few changes for stability and more friendly view. Since Pine Script has some limitations, the table from this indicator is best viewed in 1h TF.เอกสารเผยแพร่
Improvements in the visualization, increasing transparency of the colors, you should try longs when green and have caution when red.เอกสารเผยแพร่
Corrected a Minor error with RSIสคริปต์โอเพนซอร์ซ
In true TradingView spirit, the creator of this script has made it open-source, so that traders can review and verify its functionality. Kudos to the author! While you can use it for free, remember that republishing the code is subject to our House Rules.
คำจำกัดสิทธิ์ความรับผิดชอบ
The information and publications are not meant to be, and do not constitute, financial, investment, trading, or other types of advice or recommendations supplied or endorsed by TradingView. Read more in the Terms of Use.
สคริปต์โอเพนซอร์ซ
In true TradingView spirit, the creator of this script has made it open-source, so that traders can review and verify its functionality. Kudos to the author! While you can use it for free, remember that republishing the code is subject to our House Rules.
คำจำกัดสิทธิ์ความรับผิดชอบ
The information and publications are not meant to be, and do not constitute, financial, investment, trading, or other types of advice or recommendations supplied or endorsed by TradingView. Read more in the Terms of Use.