OPEN-SOURCE SCRIPT
ที่อัปเดต: 5MSM MAHESH 15
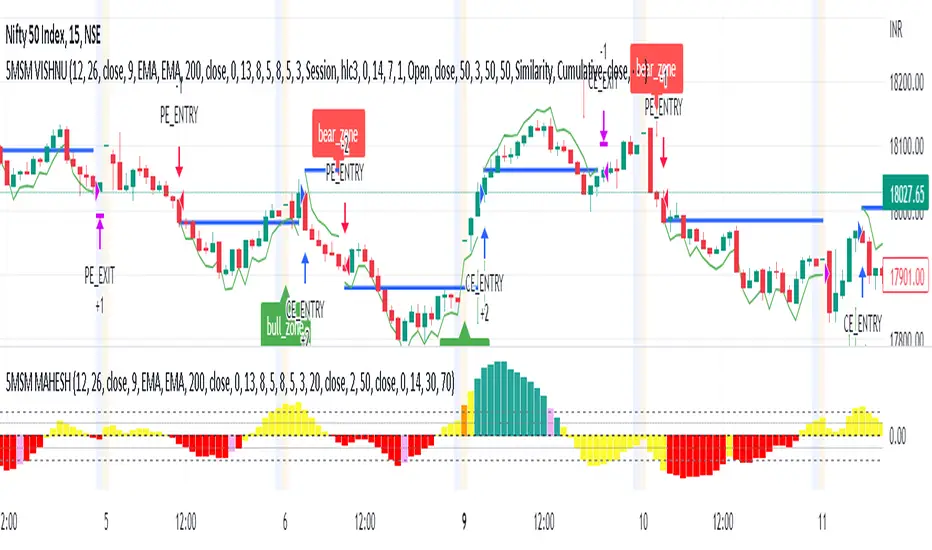
It´s just the histogram of the MACD . (Actually it´s not a histogram, I like the Area visualisation more. But you can switch.)
5min stock market property
When I´m using the MACD , I´m just searching for a divergence between Price and the MACD-histogram. I´m not interested in the MACD-signalline or the MACD-line in any way. As you can see, The omission of them leads to better visualisation. It´s much easier to spot a divergence. On the one hand because that way the histogram scales bigger, on the other hand becauce the lines can´t overdraw the histogram.
Rules bullish Divergence: Price makes a lower low, oscillator makes higher low.
Rules bearish Divergence: Price makes a higher high, oscillator makes lower high.
เอกสารเผยแพร่
possible reversal coloured in orange.เอกสารเผยแพร่
restricted reversalเอกสารเผยแพร่
RSI OB OS addedเอกสารเผยแพร่
hist increasedเอกสารเผยแพร่
increased histogram sizeเอกสารเผยแพร่
hline added for more referenceสคริปต์โอเพนซอร์ซ
ด้วยเจตนารมณ์หลักของ TradingView ผู้สร้างสคริปต์นี้ได้ทำให้เป็นโอเพนซอร์ส เพื่อให้เทรดเดอร์สามารถตรวจสอบและยืนยันฟังก์ชันการทำงานของมันได้ ขอชื่นชมผู้เขียน! แม้ว่าคุณจะใช้งานได้ฟรี แต่โปรดจำไว้ว่าการเผยแพร่โค้ดซ้ำจะต้องเป็นไปตาม กฎระเบียบการใช้งาน ของเรา
คำจำกัดสิทธิ์ความรับผิดชอบ
ข้อมูลและบทความไม่ได้มีวัตถุประสงค์เพื่อก่อให้เกิดกิจกรรมทางการเงิน, การลงทุน, การซื้อขาย, ข้อเสนอแนะ หรือคำแนะนำประเภทอื่น ๆ ที่ให้หรือรับรองโดย TradingView อ่านเพิ่มเติมใน ข้อกำหนดการใช้งาน
สคริปต์โอเพนซอร์ซ
ด้วยเจตนารมณ์หลักของ TradingView ผู้สร้างสคริปต์นี้ได้ทำให้เป็นโอเพนซอร์ส เพื่อให้เทรดเดอร์สามารถตรวจสอบและยืนยันฟังก์ชันการทำงานของมันได้ ขอชื่นชมผู้เขียน! แม้ว่าคุณจะใช้งานได้ฟรี แต่โปรดจำไว้ว่าการเผยแพร่โค้ดซ้ำจะต้องเป็นไปตาม กฎระเบียบการใช้งาน ของเรา
คำจำกัดสิทธิ์ความรับผิดชอบ
ข้อมูลและบทความไม่ได้มีวัตถุประสงค์เพื่อก่อให้เกิดกิจกรรมทางการเงิน, การลงทุน, การซื้อขาย, ข้อเสนอแนะ หรือคำแนะนำประเภทอื่น ๆ ที่ให้หรือรับรองโดย TradingView อ่านเพิ่มเติมใน ข้อกำหนดการใช้งาน