INVITE-ONLY SCRIPT
Adam-Cox LTC Realised v1 Invite-Only
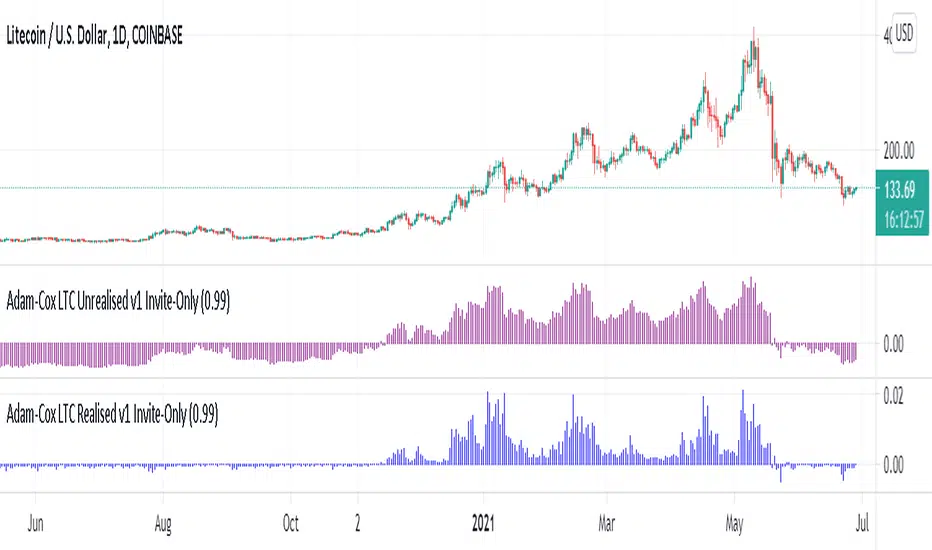
Use on daily LTC charts to understand where potential price action is occurring during peaks of profit and loss taking place on-average in the market. In the same way where large turnover can be used to identify areas of profit taking, or loss realisation (i.e. losing trade close-out) , this study examines this phenomena directly and is similar to indicators published for DOGE and BTC.
สคริปต์เฉพาะผู้ได้รับเชิญเท่านั้น
การเข้าถึงสคริปต์นี้จำกัดเฉพาะผู้ใช้ที่ได้รับอนุญาตจากผู้เขียน และมักจะต้องชำระเงินก่อน คุณสามารถเพิ่มลงในรายการโปรดของคุณได้ แต่คุณจะสามารถใช้งานได้หลังจากขออนุญาตและขอรับจากผู้เขียนเท่านั้น ติดต่อ Adam-Cox สำหรับข้อมูลเพิ่มเติม หรือทำตามคำแนะนำของผู้เขียนด้านล่าง
TradingView ไม่แนะนำให้ชำระเงินสำหรับการซื้อสคริปต์และไม่แนะนำให้ใช้งานสคริปต์นั้นๆ จนกว่าคุณจะเชื่อมั่นในผู้เขียนสคริปต์ 100% และเข้าใจว่าสคริปต์ทำงานอย่างไร ในกรณีอื่นๆ คุณสามารถหาทางเลือกโอเพนซอร์สที่ดีได้ฟรีใน สคริปต์ชุมชน ของเรา
คำแนะนำของผู้เขียน
″Use on daily LTC charts to understand where potential price action is occurring during peaks of profit and loss taking place on-average in the market.
ต้องการที่จะใช้สคริปต์นี้บนชาร์ตใช่ไหม?
คำเตือน: กรุณาอ่าน ก่อนร้องขอการเข้าถึง
คำจำกัดสิทธิ์ความรับผิดชอบ
ข้อมูลและบทความไม่ได้มีวัตถุประสงค์เพื่อก่อให้เกิดกิจกรรมทางการเงิน, การลงทุน, การซื้อขาย, ข้อเสนอแนะ หรือคำแนะนำประเภทอื่น ๆ ที่ให้หรือรับรองโดย TradingView อ่านเพิ่มเติมที่ ข้อกำหนดการใช้งาน