RSI Overbought, Oversold and over/under midline
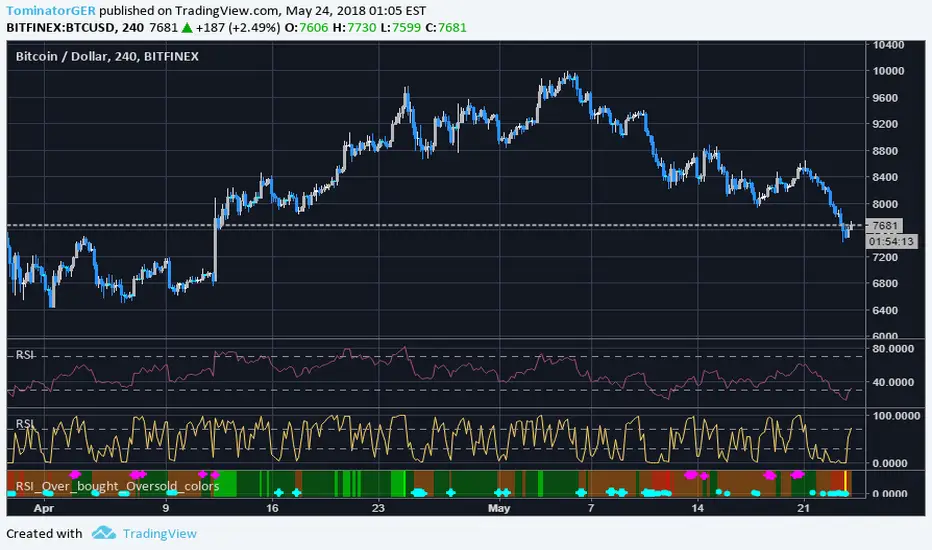
- Circles = RSI 2 period is in overbought /-sold -> Weaker buy / sell signal
- Cross = RSI 2 period is in overbought /-sold + price is above MA200 + below MA5 -> stronger buy / sell entry signal
- brown / dark green background = RSI 14 over or under midline -> Indicates bullish / bearisch momentum
- light red / green background = RSI 14 over 70 or under 30 -> Normal RSI overbought /-sold state
- red / bright green background = RSI 14 over 80 or under 20 -> Stronger RSI overbought /-sold state
- yellow background = RSI 14 over / under the 52 week high / low -> Very strong RSI overbought /-sold state
The indicator is designed to work on multiple chart layouts and smaller screens where you would not see the exact RSI states in the normal RSI indicator. You can also identify the RSI state very quick and it saves you space because you can identify the states even if the indicator window is very small.
Please give feedback in the comments what you think and what you would do better.
For access please leave a comment.
สคริปต์แบบเฉพาะผู้ได้รับเชิญเท่านั้น
เฉพาะผู้ใช้งานที่ผู้เขียนอนุมัตเท่านั้นจึงจะสามารถเข้าถึงสคริปต์นี้ได้ คุณจะต้องขอและได้รับอนุญาตก่อนใช้งาน ซึ่งโดยทั่วไปจะได้รับอนุญาตหลังจากชำระเงินแล้ว สำหรับรายละเอียดเพิ่มเติม โปรดทำตามคำแนะนำของผู้เขียนด้านล่าง หรือติดต่อ TominatorGER โดยตรง
TradingView ไม่แนะนำให้จ่ายเงินหรือใช้สคริปต์ เว้นแต่คุณจะเชื่อถือผู้เขียนและเข้าใจวิธีการทำงานของสคริปต์นั้นอย่างถ่องแท้ คุณยังสามารถหาทางเลือกแบบโอเพนซอร์สฟรีได้ใน สคริปต์ชุมชนของเรา
คำแนะนำของผู้เขียน
คำจำกัดสิทธิ์ความรับผิดชอบ
สคริปต์แบบเฉพาะผู้ได้รับเชิญเท่านั้น
เฉพาะผู้ใช้งานที่ผู้เขียนอนุมัตเท่านั้นจึงจะสามารถเข้าถึงสคริปต์นี้ได้ คุณจะต้องขอและได้รับอนุญาตก่อนใช้งาน ซึ่งโดยทั่วไปจะได้รับอนุญาตหลังจากชำระเงินแล้ว สำหรับรายละเอียดเพิ่มเติม โปรดทำตามคำแนะนำของผู้เขียนด้านล่าง หรือติดต่อ TominatorGER โดยตรง
TradingView ไม่แนะนำให้จ่ายเงินหรือใช้สคริปต์ เว้นแต่คุณจะเชื่อถือผู้เขียนและเข้าใจวิธีการทำงานของสคริปต์นั้นอย่างถ่องแท้ คุณยังสามารถหาทางเลือกแบบโอเพนซอร์สฟรีได้ใน สคริปต์ชุมชนของเรา