OPEN-SOURCE SCRIPT
Donchian Reversal Signals with Labels
Overview:
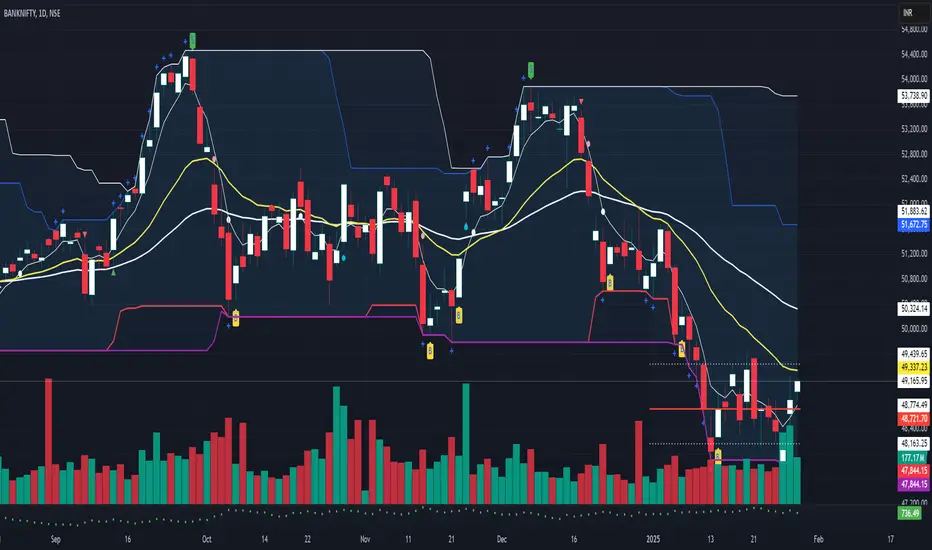
This indicator is designed to identify potential reversal signals based on price action relative to two Donchian Channels. It plots **"BUY"** and **"SELL"** labels on the chart when specific conditions are met, helping traders spot potential trend reversals.
---
Key Features:
1. Dual Donchian Channels:
- The indicator uses two Donchian Channels with user-defined lengths (`length1` and `length2`).
- The upper band of each channel is the highest high over the specified period.
- The lower band of each channel is the lowest low over the specified period.
2. Reversal Signals:
- A yellow "BUY" label appears below a green (bullish) candle if:
- The previous candle is red (bearish).
- The previous red candle touches or breaches either of the lower Donchian Channels.
- A green "SELL" label appears above a red (bearish) candle if:
- The previous candle is green (bullish).
- The previous green candle touches or breaches either of the upper Donchian Channels.
3. Visual Clarity:
- The labels are placed above or below the candles for easy visibility.
- The use of colors (yellow for buy, green for sell) makes it intuitive to interpret the signals.
---
How It Works:
1. Donchian Channel Calculation:
- The upper and lower bands of the two Donchian Channels are calculated using the highest high and lowest low over the specified periods (`length1` and `length2`).
2. Candle Color Detection:
- The script identifies whether the current and previous candles are bullish (green) or bearish (red) based on their open and close prices.
3. Signal Conditions:
- For a **"BUY" signal**:
- The current candle must be green.
- The previous candle must be red and touch or breach either of the lower Donchian Channels.
- For a **"SELL" signal**:
- The current candle must be red.
- The previous candle must be green and touch or breach either of the upper Donchian Channels.
4. Label Placement:
- The labels are plotted using `shape.labelup` and `shape.labeldown` for clear visibility.
---
Input Parameters:
- **Donchian Channel Length 1 (`length1`)**: The period for the first Donchian Channel (default: 20).
- **Donchian Channel Length 2 (`length2`)**: The period for the second Donchian Channel (default: 34).
---
How to Use:
1. Add the indicator to your chart.
2. Adjust the lengths of the Donchian Channels if needed.
3. Look for **"BUY"** and **"SELL"** labels on the chart:
- A **yellow "BUY" label** below a green candle suggests a potential bullish reversal.
- A **green "SELL" label** above a red candle suggests a potential bearish reversal.
4. Use these signals in conjunction with other technical analysis tools for confirmation.
---
Example Use Case:
- If the price touches the lower Donchian Channel and forms a red candle, followed by a green candle, a **"BUY" label** will appear, indicating a potential upward reversal.
- If the price touches the upper Donchian Channel and forms a green candle, followed by a red candle, a **"SELL" label** will appear, indicating a potential downward reversal.
---
Customization:
- You can modify the lengths of the Donchian Channels to suit your trading style.
- The colors and text of the labels can also be adjusted in the script if desired.
---
Disclaimer:
This indicator is designed to assist traders in identifying potential reversal signals. However, it should not be used in isolation. Always confirm signals with additional analysis and risk management strategies.
สคริปต์โอเพนซอร์ซ
ด้วยเจตนารมณ์หลักของ TradingView ผู้สร้างสคริปต์นี้ได้ทำให้เป็นโอเพนซอร์ส เพื่อให้เทรดเดอร์สามารถตรวจสอบและยืนยันฟังก์ชันการทำงานของมันได้ ขอชื่นชมผู้เขียน! แม้ว่าคุณจะใช้งานได้ฟรี แต่โปรดจำไว้ว่าการเผยแพร่โค้ดซ้ำจะต้องเป็นไปตาม กฎระเบียบการใช้งาน ของเรา
Learning smoothly & executing confidently.
คำจำกัดสิทธิ์ความรับผิดชอบ
ข้อมูลและบทความไม่ได้มีวัตถุประสงค์เพื่อก่อให้เกิดกิจกรรมทางการเงิน, การลงทุน, การซื้อขาย, ข้อเสนอแนะ หรือคำแนะนำประเภทอื่น ๆ ที่ให้หรือรับรองโดย TradingView อ่านเพิ่มเติมใน ข้อกำหนดการใช้งาน