OPEN-SOURCE SCRIPT
Volume Highlight
Volume Highlight
Description:
This script helps users analyze trading volume by:
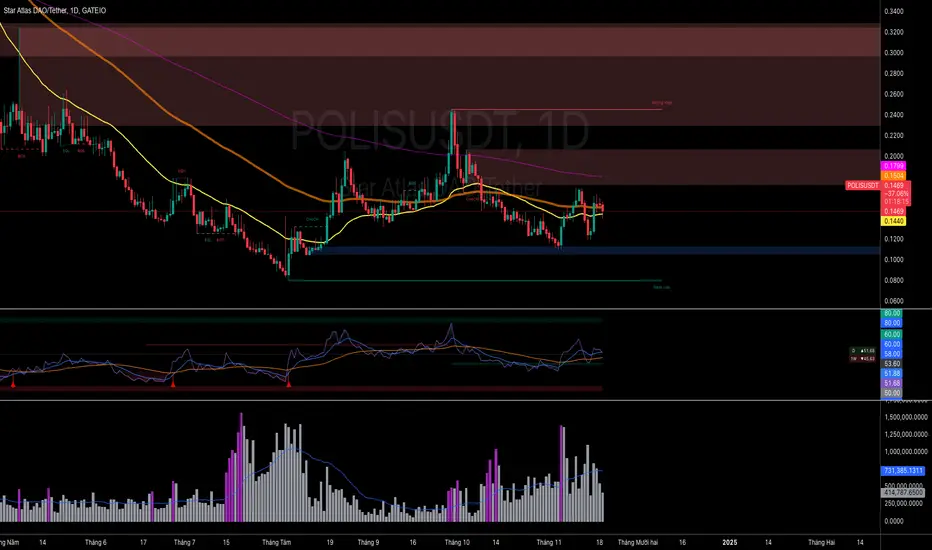
1. Highlighting the highest volume bars:
• Trading sessions with volume equal to or exceeding the highest value over the last 20 periods are displayed in purple.
• Other sessions are displayed in light gray.
2. Displaying the 20-period SMA (Simple Moving Average):
• A 20-period SMA line of the volume is included to track the general trend of trading volume.
Key Features:
• Color-coded Highlights:
• Quickly identify trading sessions with significant volume spikes.
• 20-Period SMA Line:
• Observe the overall trend of trading volume.
• Intuitive Volume Bars:
• Volume bars are clearly displayed for easy interpretation.
How to Use:
1. Add the script to your chart on TradingView.
2. Look at the color of the volume bars:
• Purple: Sessions with the highest trading volume in the past 20 periods.
• Light gray: Other sessions.
3. Use the 20-period SMA line to analyze volume trends.
Purpose:
• Analyze market momentum through trading volume.
• Support trading decisions by identifying significant volume spikes.
Illustration:
• A chart showing color-coded volume bars and the 20-period SMA line.
Description:
This script helps users analyze trading volume by:
1. Highlighting the highest volume bars:
• Trading sessions with volume equal to or exceeding the highest value over the last 20 periods are displayed in purple.
• Other sessions are displayed in light gray.
2. Displaying the 20-period SMA (Simple Moving Average):
• A 20-period SMA line of the volume is included to track the general trend of trading volume.
Key Features:
• Color-coded Highlights:
• Quickly identify trading sessions with significant volume spikes.
• 20-Period SMA Line:
• Observe the overall trend of trading volume.
• Intuitive Volume Bars:
• Volume bars are clearly displayed for easy interpretation.
How to Use:
1. Add the script to your chart on TradingView.
2. Look at the color of the volume bars:
• Purple: Sessions with the highest trading volume in the past 20 periods.
• Light gray: Other sessions.
3. Use the 20-period SMA line to analyze volume trends.
Purpose:
• Analyze market momentum through trading volume.
• Support trading decisions by identifying significant volume spikes.
Illustration:
• A chart showing color-coded volume bars and the 20-period SMA line.
สคริปต์โอเพนซอร์ซ
ด้วยเจตนารมณ์หลักของ TradingView ผู้สร้างสคริปต์นี้ได้ทำให้เป็นโอเพนซอร์ส เพื่อให้เทรดเดอร์สามารถตรวจสอบและยืนยันฟังก์ชันการทำงานของมันได้ ขอชื่นชมผู้เขียน! แม้ว่าคุณจะใช้งานได้ฟรี แต่โปรดจำไว้ว่าการเผยแพร่โค้ดซ้ำจะต้องเป็นไปตาม กฎระเบียบการใช้งาน ของเรา
คำจำกัดสิทธิ์ความรับผิดชอบ
ข้อมูลและบทความไม่ได้มีวัตถุประสงค์เพื่อก่อให้เกิดกิจกรรมทางการเงิน, การลงทุน, การซื้อขาย, ข้อเสนอแนะ หรือคำแนะนำประเภทอื่น ๆ ที่ให้หรือรับรองโดย TradingView อ่านเพิ่มเติมใน ข้อกำหนดการใช้งาน