OPEN-SOURCE SCRIPT
Volume-Price Percentile
Description:
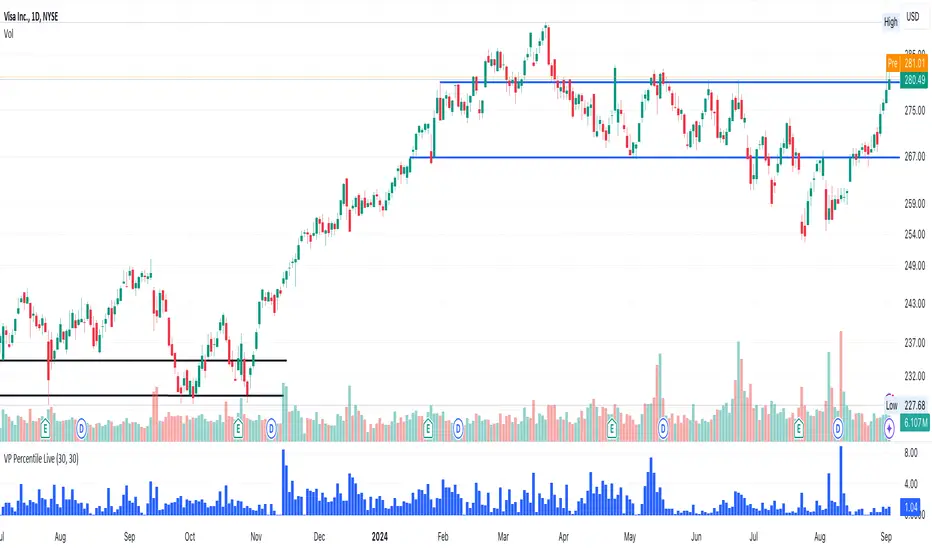
The "Volume-Price Percentile Live" indicator is designed to provide real-time analysis of the relationship between volume percentiles and price percentiles on any given timeframe. This tool helps traders assess market activity by comparing how current volume levels rank relative to historical volume data and how current price movements (specifically high-low ranges) rank relative to historical price data. The indicator visualizes the ratio of volume percentile to price percentile as a histogram, allowing traders to gauge the relative strength of volume against price movements in real time.
Functionality:
Volume Percentile: Calculates the percentile rank of the current volume within a user-defined rolling period (default is 30 bars). This percentile indicates where the current volume stands in comparison to historical volumes over the specified period.
Price Percentile: Calculates the percentile rank of the current candle's high-low difference within a user-defined rolling period (default is 30 bars). This percentile reflects the current price movement's strength relative to past movements over the specified period.
Percentile Ratio (VP Ratio): The indicator plots the ratio of the volume percentile to the price percentile. This ratio helps identify periods when volume is significantly higher or lower relative to price movement, providing insights into potential market imbalances or strength.
Real-Time Data: By fetching data from a lower timeframe (e.g., 1-minute), the indicator updates continuously within the current timeframe, offering live, intra-candle updates. This ensures that traders can see the histogram change in real-time as new data becomes available, without waiting for the current candle to close.
How to Use:
Adding the Indicator: To use this indicator, add it to your chart on TradingView by selecting it from the Indicators list once it is published publicly.
Setting Parameters:
Volume Period Length: This input sets the rolling window length for calculating the volume percentile (default is 30). You can adjust it based on the desired sensitivity or historical period relevance.
Candle Period Length: This input sets the rolling window length for calculating the price percentile based on the high-low difference of candles (default is 30). Adjust this to match your trading style or analysis period.
Interpreting the Histogram:
The histogram represents the volume percentile divided by the price percentile.
Above 1: A value greater than 1 indicates that volume is relatively strong compared to price movement, which may suggest high activity or potential accumulation/distribution phases.
Below 1: A value less than 1 suggests that price movement is relatively stronger than volume, indicating potential weakness in volume relative to price moves.
Near 1: Values close to 1 suggest a balanced relationship between volume and price movement.
Application: Use this indicator to identify potential breakout or breakdown scenarios, assess the strength of price movements, and confirm trends. When volume percentile consistently leads price percentile, it might signal sustained interest and support for the current price trend. Conversely, if volume percentile lags significantly, it might warn of potential trend weakness.
Best Practices:
Multiple Timeframe Analysis: While the indicator provides real-time updates on any timeframe, consider using it alongside higher timeframe analysis to confirm trends and volume behavior across different periods.
Customization: Adjust the period lengths based on the asset’s typical volume and price behavior, as well as your trading strategy (e.g., short-term scalping vs. long-term trend following).
Complement with Other Indicators: Use this indicator in conjunction with other volume-based tools, trend indicators, or momentum oscillators to gain a comprehensive view of market dynamics.
สคริปต์โอเพนซอร์ซ
ด้วยเจตนารมณ์หลักของ TradingView ผู้สร้างสคริปต์นี้ได้ทำให้เป็นโอเพนซอร์ส เพื่อให้เทรดเดอร์สามารถตรวจสอบและยืนยันฟังก์ชันการทำงานของมันได้ ขอชื่นชมผู้เขียน! แม้ว่าคุณจะใช้งานได้ฟรี แต่โปรดจำไว้ว่าการเผยแพร่โค้ดซ้ำจะต้องเป็นไปตาม กฎระเบียบการใช้งาน ของเรา
คำจำกัดสิทธิ์ความรับผิดชอบ
ข้อมูลและบทความไม่ได้มีวัตถุประสงค์เพื่อก่อให้เกิดกิจกรรมทางการเงิน, การลงทุน, การซื้อขาย, ข้อเสนอแนะ หรือคำแนะนำประเภทอื่น ๆ ที่ให้หรือรับรองโดย TradingView อ่านเพิ่มเติมใน ข้อกำหนดการใช้งาน