OPEN-SOURCE SCRIPT
ที่อัปเดต: Configurable Level Trading Strategy
The Dynamic Level Reversal Strategy is a trading approach designed to capitalize on price movements between key support and resistance levels. This strategy leverages configurable levels the trader determines, allowing for flexibility and adaptation to different market conditions.
Key Features:
Configurable Levels:
The strategy uses three key levels: Level 1 (Support), Level 2 (Middle), and Level 3 (Resistance). These levels can be adjusted directly within the script settings, making the strategy adaptable to various trading scenarios.
Buy and Sell Signals:
A buy signal is triggered when the price touches Level 1 and shows signs of reversal. The trader enters a position and sets an initial stop-loss just below Level 1.
As the price moves upward, the stop-loss is dynamically adjusted to just below Level 2 and Level 3, locking in profits while managing risk.
A sell signal is generated if the price reverses and crosses below the current stop-loss level, ensuring the trader exits the position with minimized losses.
Iterative Process:
The strategy allows for iterative trades, where the trader re-enters positions at Level 1 or Level 2 if the price revisits these levels, continually adjusting stop-losses and take-profit targets as the price oscillates between the defined levels.
Ideal Use Cases:
Range-Bound Markets: The strategy is particularly effective in markets where the price tends to oscillate between well-defined support and resistance levels.
Volatile Markets: The dynamic adjustment of stop-loss levels helps protect against sudden price reversals, making it suitable for volatile market conditions.
How to Use:
Set the desired levels (Level 1, Level 2, Level 3) based on your market analysis.
The script will automatically generate buy and sell signals, and adjust stop-loss levels as the price moves through the levels.
Monitor the signals and execute trades according to the strategy's guidelines.
เอกสารเผยแพร่
The Dynamic Level Reversal Strategy is a trading approach designed to capitalize on price movements between key support and resistance levels. This strategy leverages configurable levels that are determined by the trader, allowing for flexibility and adaptation to different market conditions.Key Features:
Configurable Levels:
The strategy uses three key levels: Level 1 (Support), Level 2 (Middle), and Level 3 (Resistance). These levels can be adjusted directly within the script settings, making the strategy adaptable to various trading scenarios.
Buy and Sell Signals:
A buy signal is triggered when the price touches Level 1 and shows signs of reversal. The trader enters a position and sets an initial stop-loss just below Level 1.
As the price moves upward, the stop-loss is dynamically adjusted to just below Level 2 and Level 3, locking in profits while managing risk.
A sell signal is generated if the price reverses and crosses below the current stop-loss level, ensuring that the trader exits the position with minimized losses.
Iterative Process:
The strategy allows for iterative trades, where the trader re-enters positions at Level 1 or Level 2 if the price revisits these levels, continually adjusting stop-losses and take-profit targets as the price oscillates between the defined levels.
Ideal Use Cases:
Range-Bound Markets: The strategy is particularly effective in markets where the price tends to oscillate between well-defined support and resistance levels.
Volatile Markets: The dynamic adjustment of stop-loss levels helps protect against sudden price reversals, making it suitable for volatile market conditions.
How to Use:
Set the desired levels (Level 1, Level 2, Level 3) based on your market analysis.
The script will automatically generate buy and sell signals, and adjust stop-loss levels as the price moves through the levels.
Monitor the signals and execute trades according to the strategy's guidelines.
เอกสารเผยแพร่
The Auto Support/Resistance Trading Strategy is a dynamic trading indicator designed to automatically detect and plot key support and resistance levels on a chart. This script identifies the most recent support and resistance levels based on a user-defined lookback period and calculates a middle level between them. The strategy provides buy and sell signals based on price interactions with these levels, and it adjusts stop-loss levels dynamically as the price moves through these key zones.Key Features:
Automatic Support and Resistance Detection:
The script automatically calculates the lowest low (support) and the highest high (resistance) within a user-defined lookback period. This removes the need for manual level setting, allowing the trader to focus on executing trades.
Dynamic Middle Level:
A middle level is calculated as the midpoint between the support and resistance levels, providing an additional reference point for adjusting stop-losses and setting profit targets.
Buy and Sell Signals:
Buy Signal: Triggered when the price touches and reverses from the support level, indicating a potential upward move.
Sell Signal: Generated when the price crosses below the dynamically adjusted stop-loss level, ensuring risk is managed effectively.
Stop-Loss Adjustments:
The script dynamically adjusts the stop-loss level as the price crosses the middle level and the resistance level, locking in profits as the trade progresses.
Visual Indicators:
The support, middle, and resistance levels are clearly plotted on the chart using lines, making it easy to visualize the key levels at a glance.
How to Use:
Configure the Lookback Period: Adjust the lookback parameter to define the range over which the support and resistance levels are calculated. A longer lookback period might provide more stable levels, while a shorter period can capture more recent price action.
Monitor the Signals: Watch for the script's buy and sell signals, which are indicated by labels on the chart. The strategy will manage the trade by adjusting stop-loss levels as the price moves.
Execute Trades: Use the plotted levels and signals to guide your trading decisions. The script helps to automate some aspects of trading by identifying key levels and providing actionable signals.
Ideal for:
Range-Bound Markets: Where prices tend to oscillate between support and resistance levels.
Trend Reversals: The script can help identify potential reversals when prices bounce off key support levels.
Dynamic Risk Management: With automatic stop-loss adjustments, the script supports effective risk management by locking in profits as the market moves.
เอกสารเผยแพร่
This script is designed to identify key support and resistance levels on a chart by analyzing price action over a user-defined lookback period. It is particularly useful for traders who wish to identify levels that have been tested multiple times, even allowing for minor price breaches. This approach results in more robust support and resistance levels, which are critical for making informed trading decisions.Key Features:
Lookback Period Customization:
Users can define the period over which the script looks back to detect support and resistance levels. This flexibility allows for the adjustment of the sensitivity to recent price action versus longer-term trends.
Pivot-Based Detection with Tolerance:
The script detects support and resistance based on pivot highs and lows within the lookback period. The pivot points are identified with a tolerance setting that allows minor breaches of these levels, ensuring that the most relevant and frequently tested levels are identified.
Dynamic Level Plotting:
The identified support, resistance, and middle levels are plotted directly on the chart. These levels are updated dynamically as new price data becomes available.
Adjustable Tolerance for Breaks:
The tolerance parameter lets you control how strict or lenient the script is in considering minor price breaks when determining support and resistance. This makes the script adaptable to different market conditions and trading strategies.
Visual Indicators for Buy and Sell Signals:
The script provides clear visual indicators when the price touches and reverses from the support level (buy signal) or when it crosses below the stop-loss level (sell signal). These signals help traders make timely decisions based on key price levels.
Configurable Line Length:
The script allows users to define the length of the lines that plot the support and resistance levels on the chart, ensuring they are visible over the desired period.
How to Use:
Set the Lookback Period: Adjust the lookback period to control how far back the script analyzes the price data for identifying support and resistance levels.
Adjust Tolerance: Use the tolerance setting to determine how much price can breach a level without invalidating it. This is useful for capturing more significant levels that may have been tested multiple times.
Interpret the Levels: Use the plotted support, resistance, and middle levels to guide your trading decisions. These levels provide key insights into potential areas where the price may reverse or continue its trend.
Act on Signals: Watch for the script's buy and sell signals to make informed entry and exit decisions in your trades.
Ideal for:
Swing Traders: Who need to identify and act on significant support and resistance levels.
Day Traders: Who require dynamic levels that adapt to recent price action.
Technical Analysts: Looking for a reliable way to plot and adjust key price levels on their charts.
This script is a powerful tool for identifying and trading around key price levels, offering the flexibility and precision needed to adapt to various market conditions.
เอกสารเผยแพร่
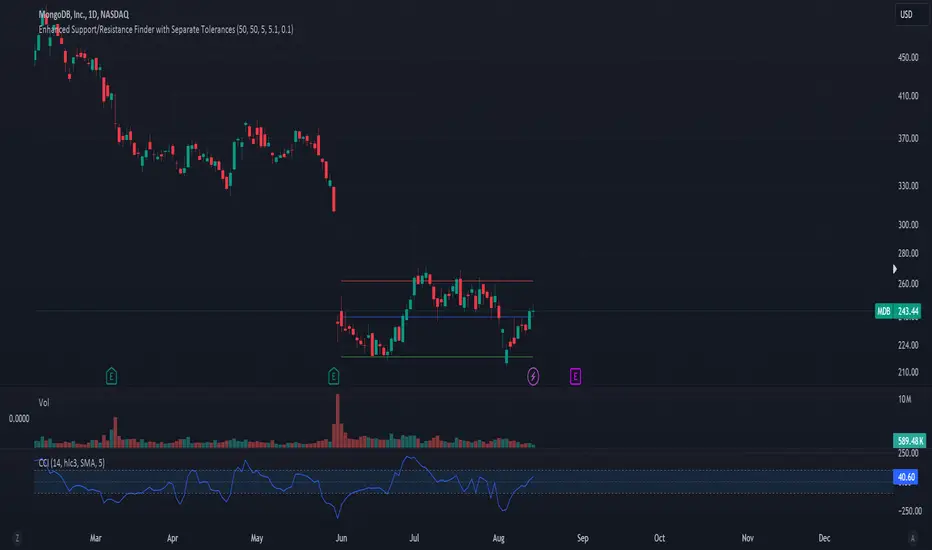
This script is designed to help traders identify critical support and resistance levels on a chart with increased flexibility. By allowing separate control over the tolerance levels for support and resistance, the script ensures that you can fine-tune these key levels to more accurately reflect market conditions, even when minor breaches occur. This tool is particularly valuable for traders who want to capture robust levels that have been tested multiple times, while still accounting for the natural fluctuations in price action.Key Features:
Customizable Lookback Period:
Users can define the lookback period, controlling how far back the script examines price data to identify support and resistance levels. This feature allows you to focus on recent price action or incorporate a longer-term perspective.
Pivot-Based Detection with Independent Tolerances:
The script identifies support and resistance levels based on pivot points within the lookback period. Importantly, it allows separate tolerance settings for support and resistance, enabling you to adjust how strictly the script treats small price breaches.
Dynamic Level Plotting:
Identified support, resistance, and middle levels are plotted directly on the chart. These levels are dynamically updated as new price data becomes available, ensuring that the plotted levels remain relevant over time.
Separate Tolerance for Support and Resistance:
Support Tolerance: This setting allows you to specify how much the price can breach below a support level before it is no longer considered valid. This is useful in capturing broader support zones that can absorb minor dips.
Resistance Tolerance: Similarly, you can adjust how much the price can breach above a resistance level before it is invalidated, helping to identify strong resistance areas that might see temporary spikes.
Visual Trading Signals:
The script provides clear visual signals when the price touches and reverses from the support level (buy signal) or crosses below the stop-loss level (sell signal). These signals can assist traders in making timely and informed trading decisions.
Configurable Line Length:
You can define the length of the lines that plot the support and resistance levels on the chart, allowing you to visualize these key levels over your desired time frame.
How to Use:
Set the Lookback Period: Adjust the lookback parameter to control how much historical data is used to detect support and resistance levels. A longer period may capture more significant levels, while a shorter period focuses on recent action.
Adjust Support and Resistance Tolerances: Fine-tune the supportTolerance and resistanceTolerance parameters to allow or disallow minor price breaches, depending on how strict you want to be with level validation.
Interpret the Plotted Levels: Use the dynamically updated support, resistance, and middle levels to guide your trading decisions, keeping in mind the tolerances you’ve set.
Act on Trading Signals: Utilize the buy and sell signals provided by the script to execute trades around these key levels, with the confidence that the levels have been robustly tested.
Ideal for:
Swing Traders: Who need to identify and trade around significant support and resistance levels that might experience minor breaches.
Day Traders: Who require dynamic and adaptable levels that reflect recent price movements.
Technical Analysts: Seeking a reliable and customizable tool to plot and adjust key price levels based on real market conditions.
This script offers a powerful way to identify and trade around key price levels, providing the flexibility needed to adapt to various market scenarios. Whether you’re looking for more accurate support and resistance detection or need a tool that can handle the nuances of price fluctuations, this script is designed to meet your needs.
สคริปต์โอเพนซอร์ซ
ด้วยเจตนารมณ์หลักของ TradingView ผู้สร้างสคริปต์นี้ได้ทำให้เป็นโอเพนซอร์ส เพื่อให้เทรดเดอร์สามารถตรวจสอบและยืนยันฟังก์ชันการทำงานของมันได้ ขอชื่นชมผู้เขียน! แม้ว่าคุณจะใช้งานได้ฟรี แต่โปรดจำไว้ว่าการเผยแพร่โค้ดซ้ำจะต้องเป็นไปตาม กฎระเบียบการใช้งาน ของเรา
คำจำกัดสิทธิ์ความรับผิดชอบ
ข้อมูลและบทความไม่ได้มีวัตถุประสงค์เพื่อก่อให้เกิดกิจกรรมทางการเงิน, การลงทุน, การซื้อขาย, ข้อเสนอแนะ หรือคำแนะนำประเภทอื่น ๆ ที่ให้หรือรับรองโดย TradingView อ่านเพิ่มเติมใน ข้อกำหนดการใช้งาน