PROTECTED SOURCE SCRIPT
Scalping level 1.3.0
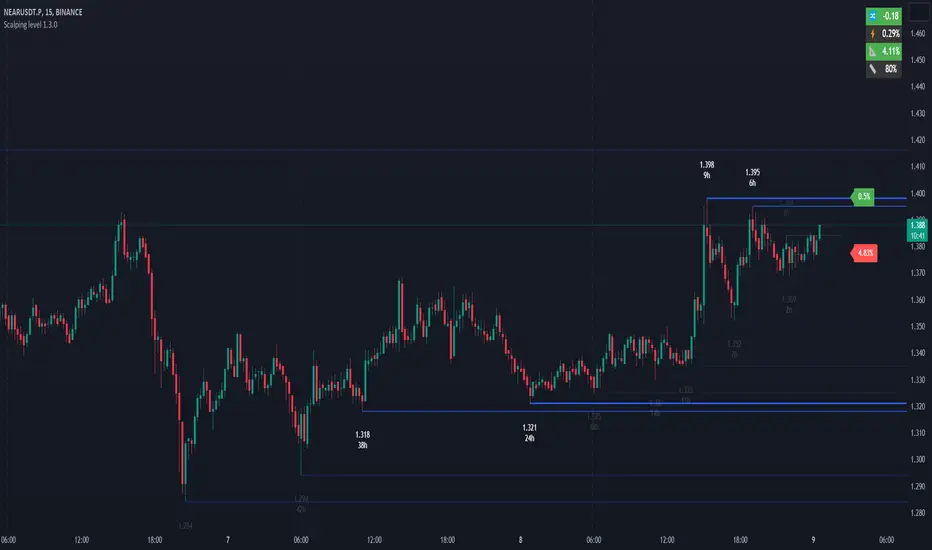
The indicator shows the horizontal levels behind which the liquidity accumulates. The indicator is based on the price extremums according to the specified settings. Each extremum is marked with a faint blue line and the price. If two or more extrema are located at the same price or close enough to each other, they are highlighted in bright blue, and it indicates a strong resistance or support level. When prices approach strong resistance levels, we can consider the situation on a long breakout or a bounce from the level in the short. As price approaches strong support levels, we could consider a breakout in the short or a bounce from the level in the long. Each level has a time (indicated at each price extremum), when it was formed in hours, the more hours ago the level was formed, the stronger it is and the more likely is the price reaction at this level.
The marks next to the price show the distance in percent to the nearest strong levels, it gives a reference point for how soon the price will approach these levels.
Additional indicators, located at the top right of the chart help to make decisions in trading.
Daily dollar volume - shows how interesting the instrument to the market participants, if the traded volume for 24 hours is low, then it is not worth to pay attention to this tool.
Bitcoin correlation - (used for the cryptocurrency market), if the coin price follows the bitcoin (the indicator value is close to 1), then you should exclude this coin, because the price is controlled by robot correlators, not market participants.
Natr - the average volatility of a 5-minute candle in %. The low value of volatility can indicate that the instrument is not active at the moment. Also it is possible to use this value as a stoploss in scalper deals.
Price change - price change for the current session in %, if the value is more than 10% (for cryptocurrencies), then the breakdown of resistance levels have a higher probability than a bounce, if the value is less than -10%, then the probability of breaking support levels have a higher than a bounce.
Percentage of average daily ATR - shows how much the price passed in % for the current session from the average daily ATR. If price passed about 100%, it is possible to consider the price reversal from resistance or support levels.
Important! When trading on levels it is necessary to consider the situation in the Depth of Market. Pay attention to large densities located near support and resistance levels.
=== Basic settings: ===
LOCAL LEVEL, MIDDLE LEVEL, GLOBAL LEVEL. Three ranges of levels (local, middle, global). For each range, you can configure the period and lifetime of the level. For example, global levels are the strongest, they have the longest period and the longest time of existence (note: 0 for Lifetime means infinite time of existence), while local levels have the shortest period and the shortest time of existence. Period - the period in which the level is built. Lifetime - time after which the level is removed from the chart. Color and width - color and width of the line.
BREAK LEVELS. Levels broken by the price. These levels are displayed for convenient tracking of previous breakouts. Parameters are set similarly to other levels.
IMPORTANT LEVELS. Important levels show behind which price range the greatest accumulation of liquidity. Important levels can be adjusted by setting the minimum number of adjacent levels, for example 2 or more, as well as the maximum distance between adjacent levels. Thus, important levels show the accumulation of price extremums, behind which there are Stop Losses of the participants.
Near level coefficient - the distance coefficient between adjacent levels, the higher the coefficient is, the greater is the acceptable price range between the levels. The coefficient is multiplied by the average ATR, as a result we get the price range. For example, if we specify 0, then strong levels will be detected only if 2 or more extrema have the same price.
Minimum near levels - the minimum number of adjacent (close to each other) levels. For example, if 2 is specified, then if 2 or more levels are situated near each other at a distance not exceeding the distance, specified in the Near level coefficient, then those levels will be displayed in bright blue color.
Week level transparent - transparency of "weak" levels located at the price extremums.
COMMON.
Max distance to level - the maximum distance of levels is set by a coefficient, it is necessary to display only the closest levels to hide the levels that are formed very far from the current price. It is calculated on the basis of ATR.
Show level time - shows level existence time.
PRICE. Visual settings of price levels on the chart
Size - print size of price on the chart
Color - color of price on the chart
Round price color - color of the round price number. The round number is the price with the last two digits 0. Example 28124.00 or 0.2500
INDICATORS. Auxiliary numeric indicators (located in the upper right corner of the chart):
Daily dollar volume, the traded volume for the last 24 hours in dollars. You can specify a volume threshold in millions of dollars, above which the value will be highlighted in green. The default value is 100 million dollars. A high value of traded volume indicates a large number of participants and increases the probability of volatility of the instrument.
Bitcoin correlation, an indicator of price correlation with bitcoin, the lower the indicator, the instrument is more independent, the closer to 1, the stronger the instrument repeats bitcoin price movements. It has a threshold value of 0.5 by default. If the indicator reading is below the threshold, it is highlighted in color.
Natr, shows the average range at which the price passes in 5 min. The higher the indicator, the higher the volatility of the instrument.
Price change, price change in % for the current session.
Percentage of average daily ATR, shows how much the price passed in % for the current session from the average daily ATR.
สคริปต์ที่ได้รับการป้องกัน
สคริปต์นี้ถูกเผยแพร่เป็นแบบ closed-source อย่างไรก็ตาม คุณสามารถใช้ได้อย่างอิสระและไม่มีข้อจำกัดใดๆ – เรียนรู้เพิ่มเติมได้ที่นี่
คำจำกัดสิทธิ์ความรับผิดชอบ
ข้อมูลและบทความไม่ได้มีวัตถุประสงค์เพื่อก่อให้เกิดกิจกรรมทางการเงิน, การลงทุน, การซื้อขาย, ข้อเสนอแนะ หรือคำแนะนำประเภทอื่น ๆ ที่ให้หรือรับรองโดย TradingView อ่านเพิ่มเติมใน ข้อกำหนดการใช้งาน