OPEN-SOURCE SCRIPT
Mr. Laz's Fibonacci MA
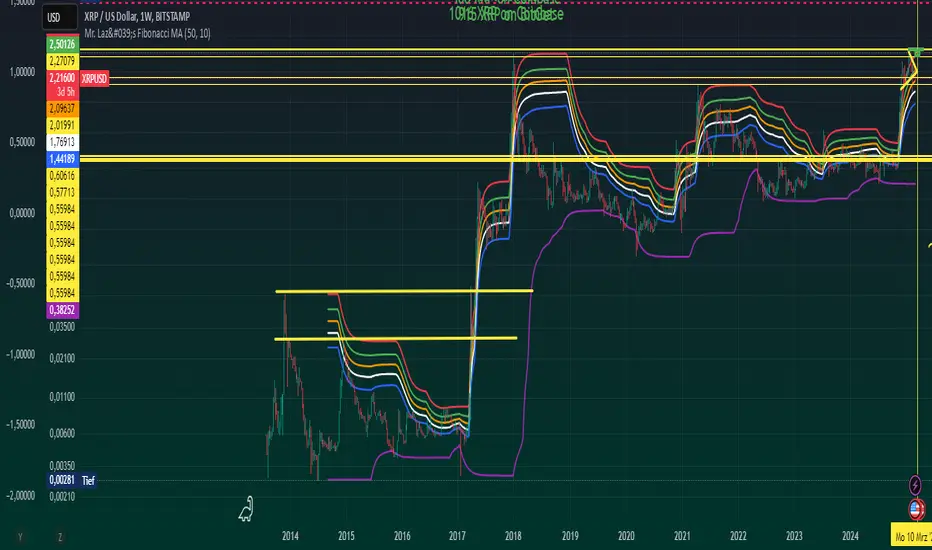
Smoothed Fibonacci Moving Average
This indicator plots six Fibonacci retracement levels overlaid on the chart, with each level smoothly adjusted using an Exponential Moving Average (EMA). The Fibonacci levels are calculated based on the highest high and lowest low over a user-defined period, and they represent key support and resistance zones that traders often watch for price reversals.
The six Fibonacci retracement levels plotted are:
0% (Fib 0): Top level (representing the highest point in the range).
23.6% (Fib 23.6%)
38.2% (Fib 38.2%)
50% (Fib 50%)
61.8% (Fib 61.8%)
100% (Fib 100): Bottom level (representing the lowest point in the range).
These levels are smoothed using a user-defined Smoothing Length, which helps reduce the "zig-zag" nature of the lines and provides a more gradual, smoother appearance as they follow the price movement. The indicator allows you to adjust the smoothing factor to control how sensitive the lines are to price changes.
The colors of the Fibonacci levels are customizable and are plotted from top to bottom as:
Red (for Fib 100%)
Green (for Fib 23.6%)
Orange (for Fib 38.2%)
White (for Fib 50%)
Blue (for Fib 61.8%)
Purple (for Fib 0%)
This indicator is useful for identifying key support and resistance zones based on Fibonacci retracement levels, with the added benefit of smoothing to make the lines more visually appealing and less prone to sudden shifts.
สคริปต์โอเพนซอร์ซ
ด้วยเจตนารมณ์หลักของ TradingView ผู้สร้างสคริปต์นี้ได้ทำให้เป็นโอเพนซอร์ส เพื่อให้เทรดเดอร์สามารถตรวจสอบและยืนยันฟังก์ชันการทำงานของมันได้ ขอชื่นชมผู้เขียน! แม้ว่าคุณจะใช้งานได้ฟรี แต่โปรดจำไว้ว่าการเผยแพร่โค้ดซ้ำจะต้องเป็นไปตาม กฎระเบียบการใช้งาน ของเรา
คำจำกัดสิทธิ์ความรับผิดชอบ
ข้อมูลและบทความไม่ได้มีวัตถุประสงค์เพื่อก่อให้เกิดกิจกรรมทางการเงิน, การลงทุน, การซื้อขาย, ข้อเสนอแนะ หรือคำแนะนำประเภทอื่น ๆ ที่ให้หรือรับรองโดย TradingView อ่านเพิ่มเติมใน ข้อกำหนดการใช้งาน