OPEN-SOURCE SCRIPT
The Commitment of Traders (COT) Index
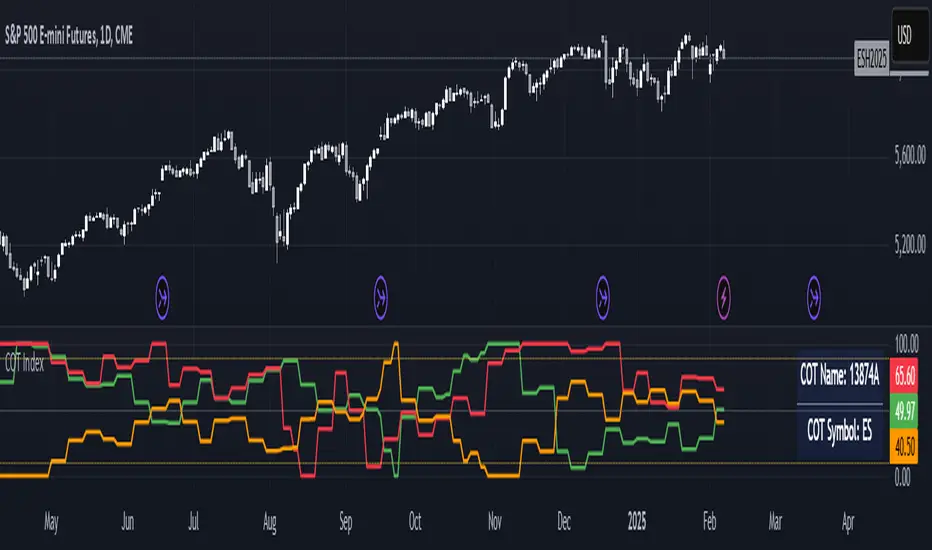
The COT Index indicator is used to measure the positioning of different market participants (Large Traders, Small Traders, and Commercial Hedgers) relative to their historical positioning over a specified lookback period. It helps traders identify extreme positioning, which can signal potential reversals or trend continuations.
Key Features of the Indicator:
COT Data Retrieval
The script pulls COT report data from the TradingView COT Library TradingView/LibraryCOT/3).
It retrieves long and short positions for three key groups:
Large Traders (Non-commercial positions) – Speculators such as hedge funds.
Small Traders (Non-reportable positions) – Small retail traders.
Commercial Hedgers (Commercial positions) – Institutions that hedge real-world positions.
Threshold Zones for Extreme Positioning:
Upper Zone Threshold (Default: 90%)
Signals potential overbought conditions (excessive buying).
Lower Zone Threshold (Default: 10%)
Signals potential oversold conditions (excessive selling).
The indicator plots these zones using horizontal lines.
The COT Index should be used in conjunction with technical analysis (support/resistance, trends, etc.). A high COT Index does not mean the market will reverse immediately—it’s an indication of extreme sentiment.
Note:
If the script does not recognize or can't find the ticker currently viewed in the COT report, the COT indicator will default to U.S. Dollar.
สคริปต์โอเพนซอร์ซ
ด้วยเจตนารมณ์หลักของ TradingView ผู้สร้างสคริปต์นี้ได้ทำให้เป็นโอเพนซอร์ส เพื่อให้เทรดเดอร์สามารถตรวจสอบและยืนยันฟังก์ชันการทำงานของมันได้ ขอชื่นชมผู้เขียน! แม้ว่าคุณจะใช้งานได้ฟรี แต่โปรดจำไว้ว่าการเผยแพร่โค้ดซ้ำจะต้องเป็นไปตาม กฎระเบียบการใช้งาน ของเรา
คำจำกัดสิทธิ์ความรับผิดชอบ
ข้อมูลและบทความไม่ได้มีวัตถุประสงค์เพื่อก่อให้เกิดกิจกรรมทางการเงิน, การลงทุน, การซื้อขาย, ข้อเสนอแนะ หรือคำแนะนำประเภทอื่น ๆ ที่ให้หรือรับรองโดย TradingView อ่านเพิ่มเติมใน ข้อกำหนดการใช้งาน