OPEN-SOURCE SCRIPT
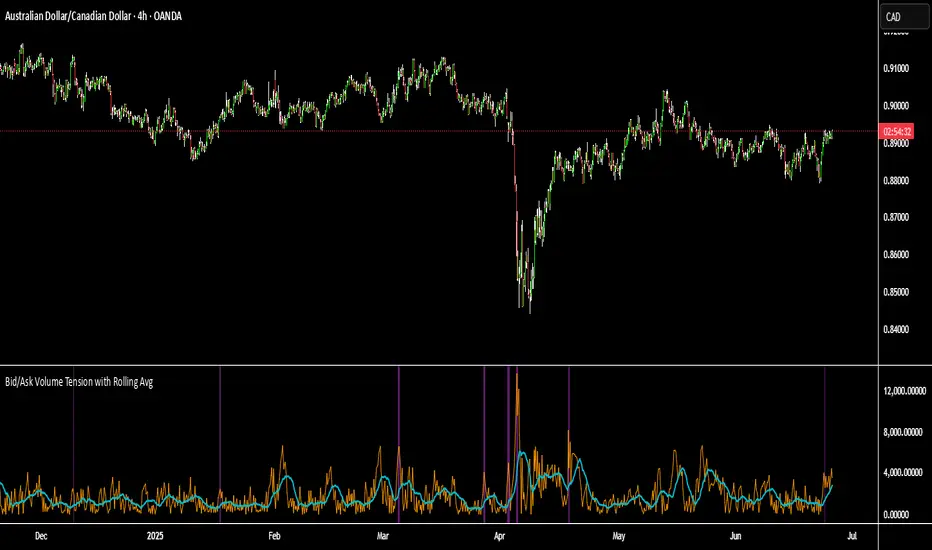
Bid/Ask Volume Tension with Rolling Avg

📊 Bid/Ask Volume Tension with Rolling Average
This indicator is designed to help traders identify pivotal moments of buildup, exhaustion, or imbalance in the market by calculating the tension between buy and sell volume.
🔍 How It Works:
Buy volume is approximated when the candle closes higher than or equal to its open.
Sell volume is approximated when the candle closes below its open.
Both are smoothed using an EMA (Exponential Moving Average) for noise reduction.
Tension is calculated as the absolute difference between smoothed buy and sell volume.
A rolling average of tension shows the baseline for normal behavior.
When instant tension rises significantly above the rolling average, it often signals:
A build-up before a large move
Aggressive order flow imbalances
Potential reversals or breakouts
🧠 How to Use:
Watch the orange line (instant tension) for spikes above the aqua line (rolling average).
Purple background highlights show when tension exceeds a customizable multiple of the average — a potential setup zone.
Use this indicator alongside:
Price action (candlestick structure)
Support/resistance
Liquidity zones or order blocks
⚙️ Settings:
Smoothing Length: Controls the responsiveness of buy/sell volume smoothing.
Rolling Avg Window: Defines the lookback period for the baseline tension.
Buildup Threshold: Triggers highlight zones when tension exceeds this multiple of the average.
🧪 Best For:
Spotting pre-breakout tension
Detecting volume-based divergences
Confirming order flow imbalances
สคริปต์โอเพนซอร์ซ
ด้วยเจตนารมณ์หลักของ TradingView ผู้สร้างสคริปต์นี้ได้ทำให้เป็นโอเพนซอร์ส เพื่อให้เทรดเดอร์สามารถตรวจสอบและยืนยันฟังก์ชันการทำงานของมันได้ ขอชื่นชมผู้เขียน! แม้ว่าคุณจะใช้งานได้ฟรี แต่โปรดจำไว้ว่าการเผยแพร่โค้ดซ้ำจะต้องเป็นไปตาม กฎระเบียบการใช้งาน ของเรา
คำจำกัดสิทธิ์ความรับผิดชอบ
ข้อมูลและบทความไม่ได้มีวัตถุประสงค์เพื่อก่อให้เกิดกิจกรรมทางการเงิน, การลงทุน, การซื้อขาย, ข้อเสนอแนะ หรือคำแนะนำประเภทอื่น ๆ ที่ให้หรือรับรองโดย TradingView อ่านเพิ่มเติมใน ข้อกำหนดการใช้งาน