PROTECTED SOURCE SCRIPT
ที่อัปเดต: Momentum Index
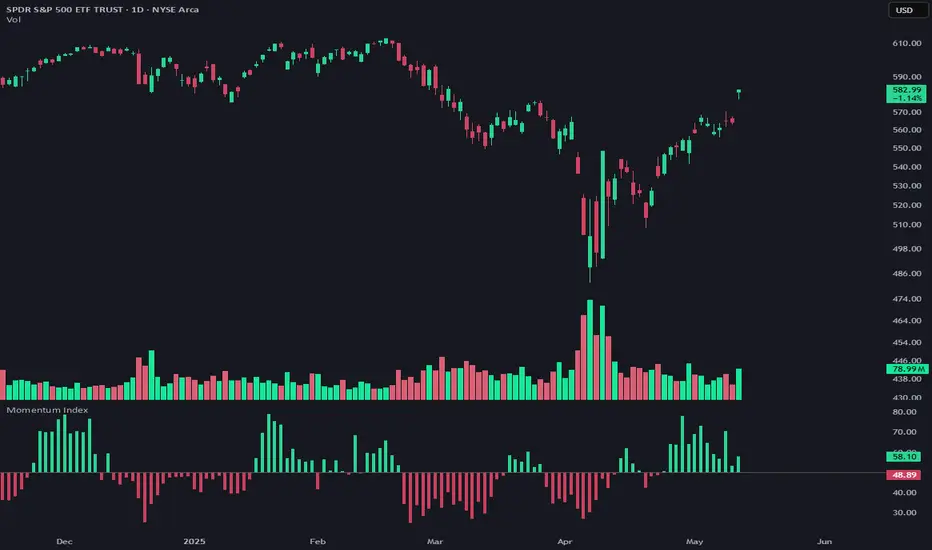
Momentum Index - Advanced Market Momentum Detector
This indicator combines two specialized oscillators to detect market momentum shifts with high precision. Unlike standard momentum indicators, it integrates both short-term volatility analysis and longer-term trend strength to provide a comprehensive view of market dynamics.
How It Works
The Momentum Index measures directional power through a dual-oscillator system:
A short-term volatility oscillator compares upward movement power (high minus previous low) against downward movement power (low minus previous high), normalized by ATR to ensure volatility independence.
A longer-term trend oscillator uses logarithmic price relationships to detect underlying trend strength through two complementary methods.
These oscillators are normalized, averaged, and enhanced with a momentum acceleration component for increased sensitivity to directional changes.
Trading Signals
The critical signal occurs when the indicator crosses the 50 line:
Crossing ABOVE 50: Bullish momentum is now dominant (green histogram)
Crossing BELOW 50: Bearish momentum is taking control (red histogram)
These crossings often precede significant price movements, making them valuable for both trend confirmation and early reversal detection.
Customization Options
Length: Adjusts the short-term oscillator sensitivity (default: 6)
Smoothing: Enables Ehlers smoothing to reduce noise
Smoothing Period: Controls the smoothing intensity
Display Options: Show as histogram or line
For optimal results, use on any timeframe from 15-minute to daily charts across all major markets. The indicator works particularly well for identifying momentum shifts at key support/resistance levels.
เอกสารเผยแพร่
Bug Fixเอกสารเผยแพร่
Length no longer limited to 100สคริปต์ที่ได้รับการป้องกัน
สคริปต์นี้ถูกเผยแพร่เป็นแบบ closed-source อย่างไรก็ตาม คุณสามารถใช้ได้อย่างอิสระและไม่มีข้อจำกัดใดๆ – เรียนรู้เพิ่มเติมได้ที่นี่
คำจำกัดสิทธิ์ความรับผิดชอบ
ข้อมูลและบทความไม่ได้มีวัตถุประสงค์เพื่อก่อให้เกิดกิจกรรมทางการเงิน, การลงทุน, การซื้อขาย, ข้อเสนอแนะ หรือคำแนะนำประเภทอื่น ๆ ที่ให้หรือรับรองโดย TradingView อ่านเพิ่มเติมใน ข้อกำหนดการใช้งาน
สคริปต์ที่ได้รับการป้องกัน
สคริปต์นี้ถูกเผยแพร่เป็นแบบ closed-source อย่างไรก็ตาม คุณสามารถใช้ได้อย่างอิสระและไม่มีข้อจำกัดใดๆ – เรียนรู้เพิ่มเติมได้ที่นี่
คำจำกัดสิทธิ์ความรับผิดชอบ
ข้อมูลและบทความไม่ได้มีวัตถุประสงค์เพื่อก่อให้เกิดกิจกรรมทางการเงิน, การลงทุน, การซื้อขาย, ข้อเสนอแนะ หรือคำแนะนำประเภทอื่น ๆ ที่ให้หรือรับรองโดย TradingView อ่านเพิ่มเติมใน ข้อกำหนดการใช้งาน