OPEN-SOURCE SCRIPT
Expected SPX Movement by timeframe

THIS INDICATOR ONLY WORKS FOR  SPXCHART
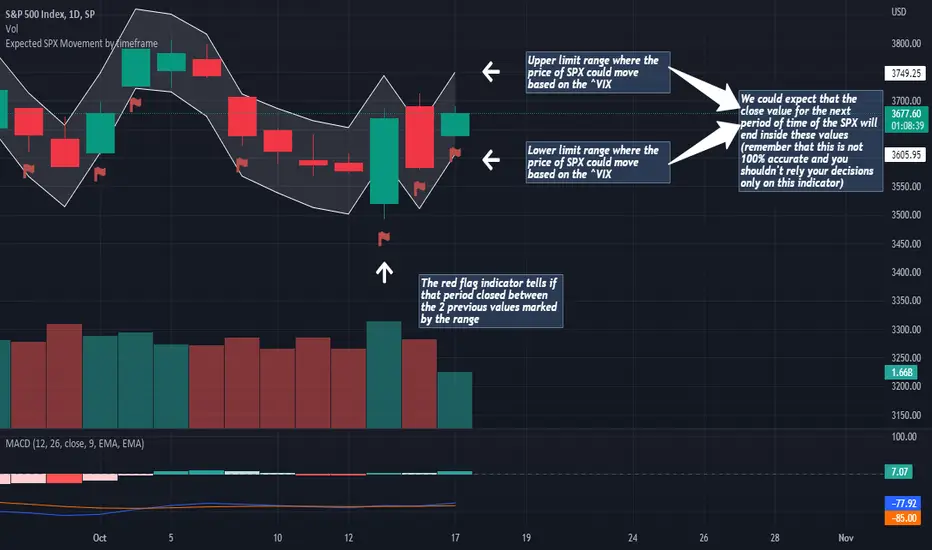
This code will help you to measure the expected movement of SPXin a previously selected timeframe based on the current value of VIX index
E.g. if the current value of VIX is 30 we calculate first the expected move of the next 12 months.
Once you have that calculation it it'll provide the range expressed as percentage of the expected move for the following period.
This script will plot that information in a range of 2 lines which represents the expected move of the SPX for the next period
The red flag indicator tells if that period closed between the 2 previous values marked by the range
This code will help you to measure the expected movement of
E.g. if the current value of VIX is 30 we calculate first the expected move of the next 12 months.
- If you selected the Daily timeframe it will calculate the expected move of SPX in the next Day by dividing the current VIX Value by the squared root of 252
(The 252 value corresponds to the approximate amount of trading sessions of the year)
If you selected the Weekly timeframe it will calculate the expected move of SPX in the next Week by dividing the current VIX Value by the squared root of 52
(The 52 value corresponds to the amount of weeks of the year)
If you selected the Monthly timeframe it will calculate the expected move of SPX in the next Week by dividing the current VIX Value by the squared root of 12
(The 12 value corresponds to the amount of months of the year)
For lower timeframes you have to calculate the amount of ticks in each trading session of the year in order to get that specific range
Once you have that calculation it it'll provide the range expressed as percentage of the expected move for the following period.
This script will plot that information in a range of 2 lines which represents the expected move of the SPX for the next period
The red flag indicator tells if that period closed between the 2 previous values marked by the range
สคริปต์โอเพนซอร์ซ
ด้วยเจตนารมณ์หลักของ TradingView ผู้สร้างสคริปต์นี้ได้ทำให้เป็นโอเพนซอร์ส เพื่อให้เทรดเดอร์สามารถตรวจสอบและยืนยันฟังก์ชันการทำงานของมันได้ ขอชื่นชมผู้เขียน! แม้ว่าคุณจะใช้งานได้ฟรี แต่โปรดจำไว้ว่าการเผยแพร่โค้ดซ้ำจะต้องเป็นไปตาม กฎระเบียบการใช้งาน ของเรา
คำจำกัดสิทธิ์ความรับผิดชอบ
ข้อมูลและบทความไม่ได้มีวัตถุประสงค์เพื่อก่อให้เกิดกิจกรรมทางการเงิน, การลงทุน, การซื้อขาย, ข้อเสนอแนะ หรือคำแนะนำประเภทอื่น ๆ ที่ให้หรือรับรองโดย TradingView อ่านเพิ่มเติมใน ข้อกำหนดการใช้งาน