OPEN-SOURCE SCRIPT
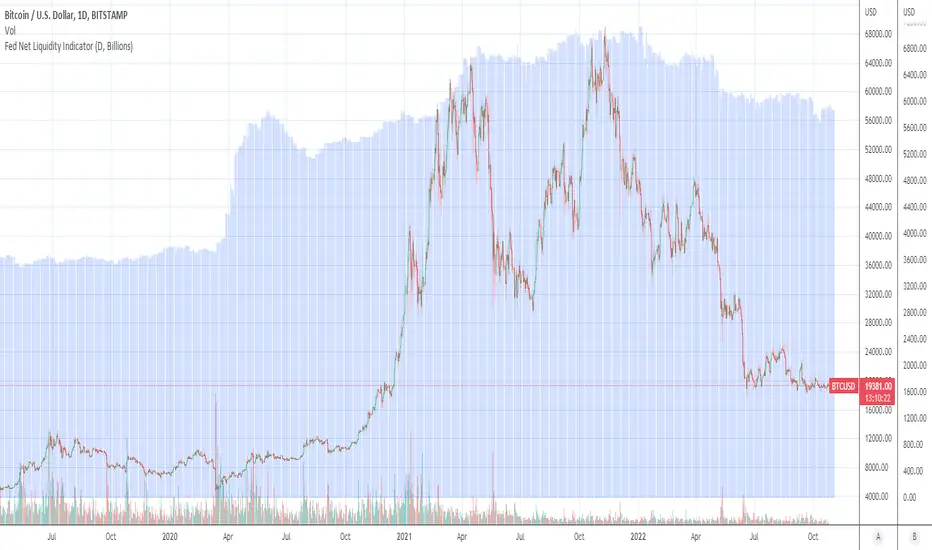
Fed Net Liquidity Indicator (24-Oct-2022 update)

This indicator is an implementation of the USD Liquidity Index originally proposed by Arthur Hayes based on the initial implementation of jlb05013, kudos to him!
I have incorporated subsequent additions (Standing Repo Facility and Central Bank Liquidity Swaps lines) and dealt with some recent changes in reporting units from TradingView.
This is a macro indicator that aims at tracking how much USD liquidity is available to chase financial assets:
- When the FED is expanding liquidity, financial asset prices tend to increase
- When the FED is contracting liquidity, financial asset prices tend to decrease
Here is the current calculation:
Net Liquidity =
(+) The Fed’s Balance Sheet (FRED:WALCL)
(-) NY Fed Total Amount of Accepted Reverse Repo Bids (FRED:RRPONTTLD)
(-) US Treasury General Account Balance Held at NY Fed (FRED:WTREGEN)
(+) NY Fed - Standing Repo Facility (FRED:RPONTSYD)
(+) NY Fed - Central Bank Liquidity Swaps (FRED:SWPT)
สคริปต์โอเพนซอร์ซ
ด้วยเจตนารมณ์หลักของ TradingView ผู้สร้างสคริปต์นี้ได้ทำให้เป็นโอเพนซอร์ส เพื่อให้เทรดเดอร์สามารถตรวจสอบและยืนยันฟังก์ชันการทำงานของมันได้ ขอชื่นชมผู้เขียน! แม้ว่าคุณจะใช้งานได้ฟรี แต่โปรดจำไว้ว่าการเผยแพร่โค้ดซ้ำจะต้องเป็นไปตาม กฎระเบียบการใช้งาน ของเรา
คำจำกัดสิทธิ์ความรับผิดชอบ
ข้อมูลและบทความไม่ได้มีวัตถุประสงค์เพื่อก่อให้เกิดกิจกรรมทางการเงิน, การลงทุน, การซื้อขาย, ข้อเสนอแนะ หรือคำแนะนำประเภทอื่น ๆ ที่ให้หรือรับรองโดย TradingView อ่านเพิ่มเติมใน ข้อกำหนดการใช้งาน