OPEN-SOURCE SCRIPT
Slingshot Trend 🎯⏰
How to Use the Slingshot Trend Indicator 🎯⏰ (65-Minute Timeframe)
The **Slingshot Trend Indicator** helps spot bullish trend entries using price action and EMAs, optimized for your favorite 65-minute timeframe. Here’s a simple guide:
⚙️ Setup
- Add the indicator to your chart.
- Set the 89 EMA timeframe to 65 minutes (or keep the default 195 minutes for higher-timeframe confirmation).
🔑 Key Features
- **Slingshot EMA**: Short-term EMA (default length: 4) to detect breakouts.
- **EMA Stack**: Confirms bullish trend when 21 EMA > 34 EMA > 55 EMA > 89 EMA.
- **Price Above 89 EMA**: Ensures price is above the 65-minute 89 EMA.
- **ATR Targets**: Uses 14-period ATR for dynamic price targets.
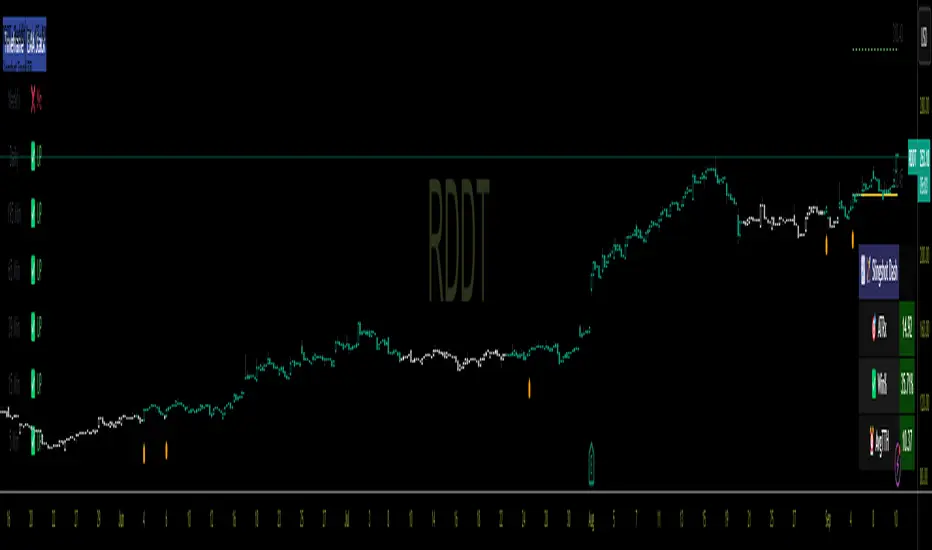
- **Visuals**:
- Blue EMA line (optional).
- Teal bars for bullish conditions (optional).
- Orange labels for entry signals (optional).
- Yellow entry line and green dashed target line (optional).
- Price labels for entry/target (optional).
- ATR dashboard showing average ATR multiple, win %, and time-to-target (optional).
📘 How to Trade
- **Entry**: Go long when an orange label appears (price closes above Slingshot EMA after three closes below, with bullish EMAs on the 65-minute chart).
- **Target**: Aim for the green dashed line (entry price + ATR-based target).
- **Exit**: Close when bullish conditions end (EMAs not stacked or price below 65-minute 89 EMA).
- **Stop Loss**: Not included; consider 2× ATR below entry or a support level.
- **Alerts**: Enable “First Trending SlingShot” for entry notifications.
✨ Customize
Adjust in settings:
- 89 EMA timeframe (e.g., set to 65 minutes).
- Bar color (default: teal).
- Toggle EMA line, bar coloring, entry labels, lines, price labels, and dashboard.
- Slingshot EMA length (default: 4).
💡 Tips
- Backtest on the 65-minute timeframe for your asset.
- Combine with support/resistance or other indicators.
- Use proper risk management.
The **Slingshot Trend Indicator** helps spot bullish trend entries using price action and EMAs, optimized for your favorite 65-minute timeframe. Here’s a simple guide:
⚙️ Setup
- Add the indicator to your chart.
- Set the 89 EMA timeframe to 65 minutes (or keep the default 195 minutes for higher-timeframe confirmation).
🔑 Key Features
- **Slingshot EMA**: Short-term EMA (default length: 4) to detect breakouts.
- **EMA Stack**: Confirms bullish trend when 21 EMA > 34 EMA > 55 EMA > 89 EMA.
- **Price Above 89 EMA**: Ensures price is above the 65-minute 89 EMA.
- **ATR Targets**: Uses 14-period ATR for dynamic price targets.
- **Visuals**:
- Blue EMA line (optional).
- Teal bars for bullish conditions (optional).
- Orange labels for entry signals (optional).
- Yellow entry line and green dashed target line (optional).
- Price labels for entry/target (optional).
- ATR dashboard showing average ATR multiple, win %, and time-to-target (optional).
📘 How to Trade
- **Entry**: Go long when an orange label appears (price closes above Slingshot EMA after three closes below, with bullish EMAs on the 65-minute chart).
- **Target**: Aim for the green dashed line (entry price + ATR-based target).
- **Exit**: Close when bullish conditions end (EMAs not stacked or price below 65-minute 89 EMA).
- **Stop Loss**: Not included; consider 2× ATR below entry or a support level.
- **Alerts**: Enable “First Trending SlingShot” for entry notifications.
✨ Customize
Adjust in settings:
- 89 EMA timeframe (e.g., set to 65 minutes).
- Bar color (default: teal).
- Toggle EMA line, bar coloring, entry labels, lines, price labels, and dashboard.
- Slingshot EMA length (default: 4).
💡 Tips
- Backtest on the 65-minute timeframe for your asset.
- Combine with support/resistance or other indicators.
- Use proper risk management.
สคริปต์โอเพนซอร์ซ
ด้วยเจตนารมณ์หลักของ TradingView ผู้สร้างสคริปต์นี้ได้ทำให้มันเป็นโอเพ่นซอร์ส เพื่อให้เทรดเดอร์สามารถตรวจสอบและยืนยันการทำงานของสคริปต์ได้ ขอแสดงความชื่นชมผู้เขียน! แม้ว่าคุณจะสามารถใช้งานได้ฟรี แต่อย่าลืมว่าการเผยแพร่โค้ดซ้ำนั้นจะต้องเป็นไปตามกฎระเบียบการใช้งานของเรา
คำจำกัดสิทธิ์ความรับผิดชอบ
ข้อมูลและบทความไม่ได้มีวัตถุประสงค์เพื่อก่อให้เกิดกิจกรรมทางการเงิน, การลงทุน, การซื้อขาย, ข้อเสนอแนะ หรือคำแนะนำประเภทอื่น ๆ ที่ให้หรือรับรองโดย TradingView อ่านเพิ่มเติมที่ ข้อกำหนดการใช้งาน