OPEN-SOURCE SCRIPT
Balgat Ekibi
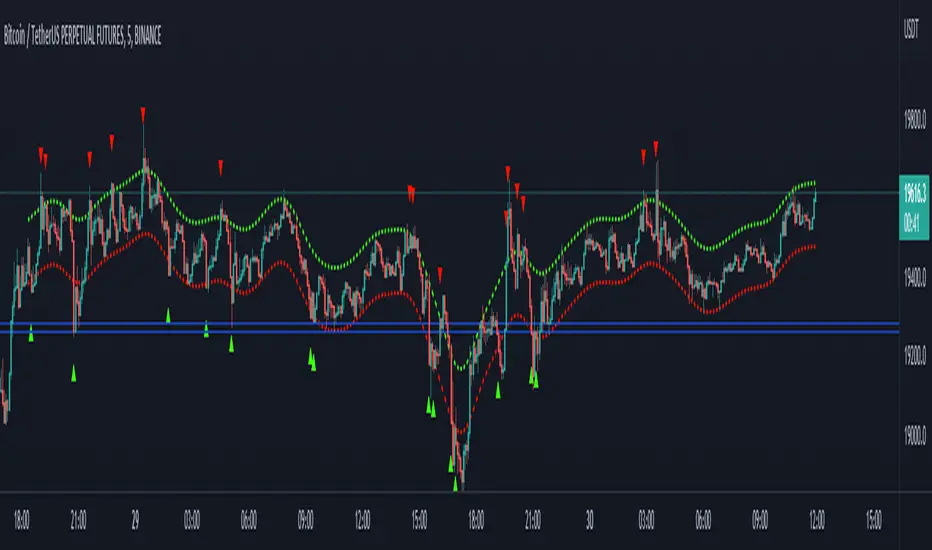
Bands are calculated with the std error and variance of the price actions. So if price cross up or cross down the variance bands, you could expect a reversal movement.
So if price cross up with the bands and after that there is a reversal candle movement, a short position could be taken.
If price cross down to the bands and after that there is a reversal candle movement, a long positon could be taken.
All risk management and money management is up to you.
So if price cross up with the bands and after that there is a reversal candle movement, a short position could be taken.
If price cross down to the bands and after that there is a reversal candle movement, a long positon could be taken.
All risk management and money management is up to you.
สคริปต์โอเพนซอร์ซ
ด้วยเจตนารมณ์หลักของ TradingView ผู้สร้างสคริปต์นี้ได้ทำให้เป็นโอเพนซอร์ส เพื่อให้เทรดเดอร์สามารถตรวจสอบและยืนยันฟังก์ชันการทำงานของมันได้ ขอชื่นชมผู้เขียน! แม้ว่าคุณจะใช้งานได้ฟรี แต่โปรดจำไว้ว่าการเผยแพร่โค้ดซ้ำจะต้องเป็นไปตาม กฎระเบียบการใช้งาน ของเรา
คำจำกัดสิทธิ์ความรับผิดชอบ
ข้อมูลและบทความไม่ได้มีวัตถุประสงค์เพื่อก่อให้เกิดกิจกรรมทางการเงิน, การลงทุน, การซื้อขาย, ข้อเสนอแนะ หรือคำแนะนำประเภทอื่น ๆ ที่ให้หรือรับรองโดย TradingView อ่านเพิ่มเติมใน ข้อกำหนดการใช้งาน