OPEN-SOURCE SCRIPT
Mobo Bands
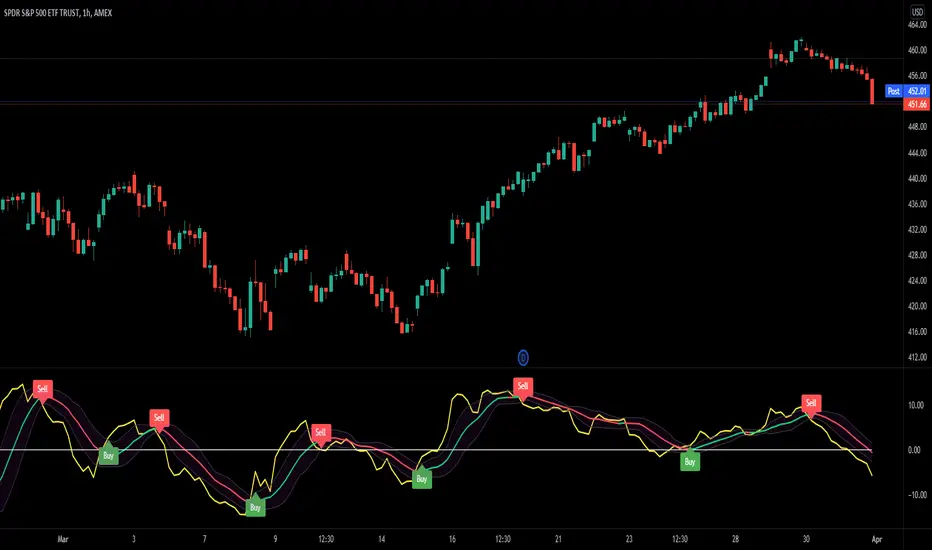
This indicator is the Mobo Bands (Momentum Breakout Bands). These bands are bollinger bands that have an adjusted standard deviation. There are Buy signals when it has momentum breakouts above the bands for moves to the upside and Sell signals when it has momentum breakouts below the bands for moves to the downside. The bands simply suggest that all markets have periods of chop which we all know to be true. While the price is inside the bands it is said to be trendless. Once the breakouts happen you can take trades in the breakout direction. I like to use these to swing trade options on the hourly timeframe but the bands should work on most instruments and timeframes. I like to use it to take swings on SPY on the 1 hour chart for entries and use the Daily chart for trend confirmation.
สคริปต์โอเพนซอร์ซ
ด้วยเจตนารมณ์หลักของ TradingView ผู้สร้างสคริปต์นี้ได้ทำให้เป็นโอเพนซอร์ส เพื่อให้เทรดเดอร์สามารถตรวจสอบและยืนยันฟังก์ชันการทำงานของมันได้ ขอชื่นชมผู้เขียน! แม้ว่าคุณจะใช้งานได้ฟรี แต่โปรดจำไว้ว่าการเผยแพร่โค้ดซ้ำจะต้องเป็นไปตาม กฎระเบียบการใช้งาน ของเรา
คำจำกัดสิทธิ์ความรับผิดชอบ
ข้อมูลและบทความไม่ได้มีวัตถุประสงค์เพื่อก่อให้เกิดกิจกรรมทางการเงิน, การลงทุน, การซื้อขาย, ข้อเสนอแนะ หรือคำแนะนำประเภทอื่น ๆ ที่ให้หรือรับรองโดย TradingView อ่านเพิ่มเติมใน ข้อกำหนดการใช้งาน