Sniper Trade Fx Heat Map
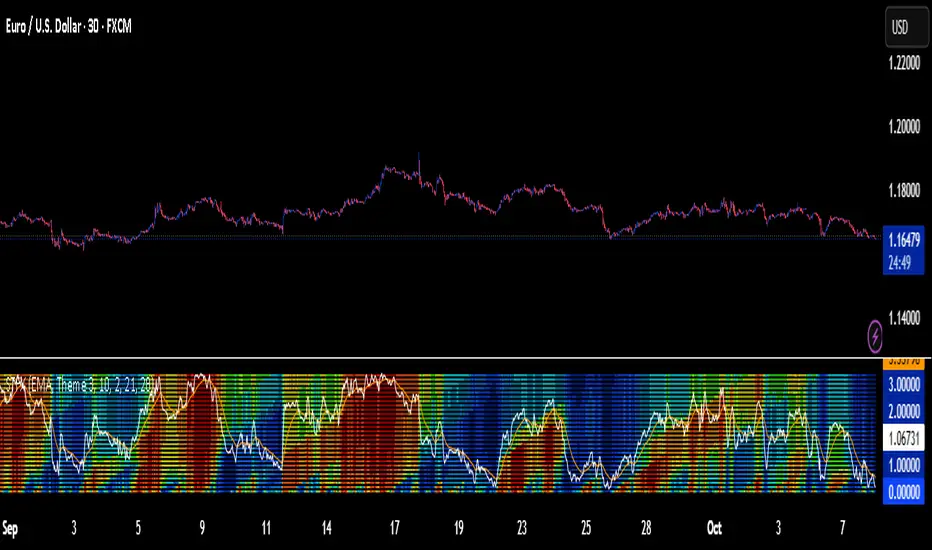
The Sniper Trade Fx Heat Map is a custom oscillator built from a stack of 28 stochastic oscillators, arranged horizontally and vertically, creating a layered “heat map” view of market momentum.
Lower rows = short-term stochastics (faster, sensitive to quick moves).
Upper rows = long-term stochastics (slower, capture major swings).
Each stochastic value is interpreted and color-coded depending on strength.
The average of all 28 stochastics is calculated → this creates the Fast line.
The Fast line is then smoothed to create a Slow line for confirmation.
Optionally, the candle bars are colored to reflect the oscillator state.
This setup gives a multi-timeframe momentum map, showing when the market is overbought, oversold, or neutral at a glance.
🎨 Color Logic by Theme
🔹 Theme 1 (Classic)
High stochastic values (50–100) = Shades of Green → Overbought / bullish momentum.
Low stochastic values (0–50) = Shades of Red → Oversold / bearish momentum.
👉 This is the most traditional color scheme: Green = Up, Red = Down.
🔹 Theme 2 (Aqua / Purple)
High stochastic values (50–100) = Shades of Aqua / Teal → Overbought / bullish momentum.
Low stochastic values (0–50) = Shades of Purple / Violet → Oversold / bearish momentum.
👉 Useful if you prefer cooler tones to distinguish trend phases.
🔹 Theme 3 (Heat Spectrum)
High stochastic values (50–100) = Red → Yellow → Green gradient → Overbought / bullish momentum.
Deep Red = extremely overbought.
Yellow = mid-high.
Green = topping but stabilizing.
Low stochastic values (0–50) = Blue → Cyan gradient → Oversold / bearish momentum.
Dark Blue = extremely oversold.
Lighter Cyan = recovering.
👉 This theme gives a heat map feel, with red showing extreme highs and blue showing extreme lows.
📈 Trading Directions
Look at the Heat Map Layers
If most rows are the same color (all green, all aqua, or all red/yellow depending on theme), momentum is strongly aligned.
If colors are mixed (checkerboard), market is choppy → avoid trades.
Use Fast/Slow Oscillator Crossovers
Bullish Signal (Buy): Fast crosses above Slow while the heat map is showing oversold colors (Red in Theme 1, Purple in Theme 2, Blue in Theme 3).
Bearish Signal (Sell): Fast crosses below Slow while the heat map is showing overbought colors (Green in Theme 1, Aqua in Theme 2, Red/Yellow in Theme 3).
Bar Coloring for Entries
When enabled, candles will automatically reflect the dominant heat map color.
Enter trades when candle colors confirm the Fast/Slow crossover direction.
✅ Summary Rule of Thumb:
Theme 1: Green = overbought, Red = oversold.
Theme 2: Aqua = overbought, Purple = oversold.
Theme 3: Red/Yellow/Green = overbought, Blue/Cyan = oversold.
สคริปต์แบบเฉพาะผู้ได้รับเชิญเท่านั้น
เฉพาะผู้ใช้ที่ได้รับการอนุมัติจากผู้เขียนเท่านั้นที่สามารถเข้าถึงสคริปต์นี้ได้ คุณจะต้องร้องขอและได้รับอนุญาตก่อนจึงจะสามารถใช้งานได้ โดยปกติจะได้รับอนุญาตหลังจากชำระเงินแล้ว สำหรับรายละเอียดเพิ่มเติม ทำตามคำแนะนำของผู้เขียนด้านล่างหรือติดต่อ snipertradefxconnect โดยตรง
TradingView ไม่แนะนำให้ชำระเงินหรือใช้สคริปต์ เว้นแต่ว่าคุณจะเชื่อถือผู้เขียนสคริปต์และเข้าใจวิธีการทำงานของมัน คุณยังอาจพบทางเลือกของโอเพนซอร์ส แบบฟรีในสคริปต์ชุมชนของเรา
คำแนะนำของผู้เขียน
คำจำกัดสิทธิ์ความรับผิดชอบ
สคริปต์แบบเฉพาะผู้ได้รับเชิญเท่านั้น
เฉพาะผู้ใช้ที่ได้รับการอนุมัติจากผู้เขียนเท่านั้นที่สามารถเข้าถึงสคริปต์นี้ได้ คุณจะต้องร้องขอและได้รับอนุญาตก่อนจึงจะสามารถใช้งานได้ โดยปกติจะได้รับอนุญาตหลังจากชำระเงินแล้ว สำหรับรายละเอียดเพิ่มเติม ทำตามคำแนะนำของผู้เขียนด้านล่างหรือติดต่อ snipertradefxconnect โดยตรง
TradingView ไม่แนะนำให้ชำระเงินหรือใช้สคริปต์ เว้นแต่ว่าคุณจะเชื่อถือผู้เขียนสคริปต์และเข้าใจวิธีการทำงานของมัน คุณยังอาจพบทางเลือกของโอเพนซอร์ส แบบฟรีในสคริปต์ชุมชนของเรา