Universal Valuation Z_score -> PROFABIGHI_CAPITAL
The Universal Valuation Z-Score indicator provides a comprehensive multi-indicator valuation framework by computing Z-scores across momentum oscillators, volatility bands, and risk-adjusted metrics to assess over/undervaluation relative to historical norms. It weights these signals based on correlation strength with price, generates fair value estimates, and highlights extreme levels through color-coded candles and vertical bars for intuitive market positioning.
⚙️ General Settings
- Z-Score Lookback Period: Adjustable historical window for normalizing indicator deviations from mean
- Correlation Analysis Period: Timeframe for measuring indicator-price relationships and beta factors
- Show Threshold Lines: Toggle visibility of dynamic overbought/oversold boundaries on the chart
- Show Indicator Selection: Choose to display the composite average Z-score or a specific metric like RSI or Sharpe
- Use Price Weighting: Incorporate direct price Z-score into the final valuation blend
- Adaptive Weighting: Dynamically adjust indicator influence based on their correlation to price movements
📊 Barchoice Settings
- Overbought Threshold: Extreme upper level triggering vertical bar highlights for potential reversals
- Oversold Threshold: Extreme lower level signaling vertical bar alerts for buying opportunities
📈 RSI Configuration
- Enable RSI: Toggle inclusion of RSI Z-score in the weighted valuation
- RSI Source: Select the price input for momentum oscillation
- RSI Length: Period for calculating relative strength index deviations
📈 ROC Configuration
- Enable ROC: Include rate-of-change Z-score for momentum acceleration analysis
- ROC Period: Lookback for measuring percentage price shifts
📈 BB% Configuration
- Enable BB%: Factor in Bollinger Bands percentage Z-score for volatility positioning
- BB% Source: Data input for band-based normalization
- BB Length: Smoothing period for the central moving average
- BB Standard Deviation: Multiplier defining band width for extreme deviation detection
📈 CCI Configuration
- Enable CCI: Add Commodity Channel Index Z-score for cyclical deviation tracking
- CCI Source: Typical price or custom input for momentum extremes
- CCI Length: Period for typical price averaging and deviation
📈 Crosby Ratio Configuration
- Enable Crosby Ratio: Incorporate angle-based trend strength Z-score
- Crosby Length: Smoothing span for Heikin Ashi close and ATR comparison
📈 Sharpe Ratio Configuration
- Enable Sharpe Ratio: Include risk-adjusted return Z-score for efficiency weighting
- Sharpe Period: Window for return/volatility normalization
- Sharpe Smoothing: EMA length to stabilize efficiency readings
📈 Sortino Ratio Configuration
- Enable Sortino Ratio: Factor downside-focused efficiency Z-score
- Sortino Period: Historical scope for negative deviation analysis
- Risk-Free Rate: Benchmark yield subtracted from returns
- Sortino Smoothing: Filter for refined downside ratio
📈 Omega Ratio Configuration
- Enable Omega Ratio: Add probability-weighted gains/losses Z-score
- Omega Period: Lookback for return distribution evaluation
- Target Return: Threshold separating gains from losses
- Omega Smoothing: EMA to smooth ratio fluctuations
📏 Threshold Values
- Extreme Overbought Level: Upper Z-score boundary for strongest sell signals
- Extreme Oversold Level: Lower Z-score boundary for strongest buy signals
- Overbought Level: Moderate upper threshold for cautionary alerts
- Oversold Level: Moderate lower threshold for opportunity alerts
- Neutral Upper: Boundary separating fair value from slight overvaluation
- Neutral Lower: Boundary separating fair value from slight undervaluation
🎨 Color Settings
- Neutral Color: Default shade for balanced Z-score zones
- Overbought Color: Alert red for high valuation extremes
- Oversold Color: Alert green for low valuation extremes
- Neutral Upper Color: Subtle pink for mild overvaluation
- Neutral Lower Color: Subtle teal for mild undervaluation
- Light Overbought: Pale red for approaching overbought
- Light Oversold: Pale green for approaching oversold
- Zero Line Color: Gray reference for fair value centerline
📊 Valuation Calculation Methods
Z-Score Normalization:
- Computes standard deviations from historical means for each enabled indicator
- Standardizes diverse metrics into comparable deviation scores
- Handles insufficient data with null values for robustness
Correlation and Beta Analysis:
- Measures linear relationships between indicator Z-scores and price movements
- Calculates sensitivity (beta) for scaling deviations to price impact
- Uses rolling windows to capture evolving indicator relevance
Weighted Composite Formation:
- Applies equal or correlation-based weights to blend indicator Z-scores
- Incorporates price Z-score optionally for direct market alignment
- Adjusts via beta and absolute correlation for predictive strength
Fair Value Estimation:
- Derives mean price over lookback as central valuation anchor
- Projects expected price from composite Z-score and standard deviation
- Generates symmetric threshold bands at ±1, ±2, ±3 deviations
📈 Visual and Status Features
Z-Score Overlay Plot:
- Displays selected or average Z-score as a dynamic line on price chart
- Color gradients from neutral to extreme for instant valuation cues
- Zero line and threshold horizontals for reference boundaries
Candle Coloring:
- Tints bars based on Z-score zones for quick over/undervaluation scanning
- Applies to current bar only to avoid historical clutter
- Integrates with overlay for contextual price action review
Vertical Extreme Bars:
- Highlights bars where price wicks touch extreme Z-derived levels
- Semi-transparent backgrounds for non-intrusive alerts
- Combines price and Z-score conditions for dual confirmation
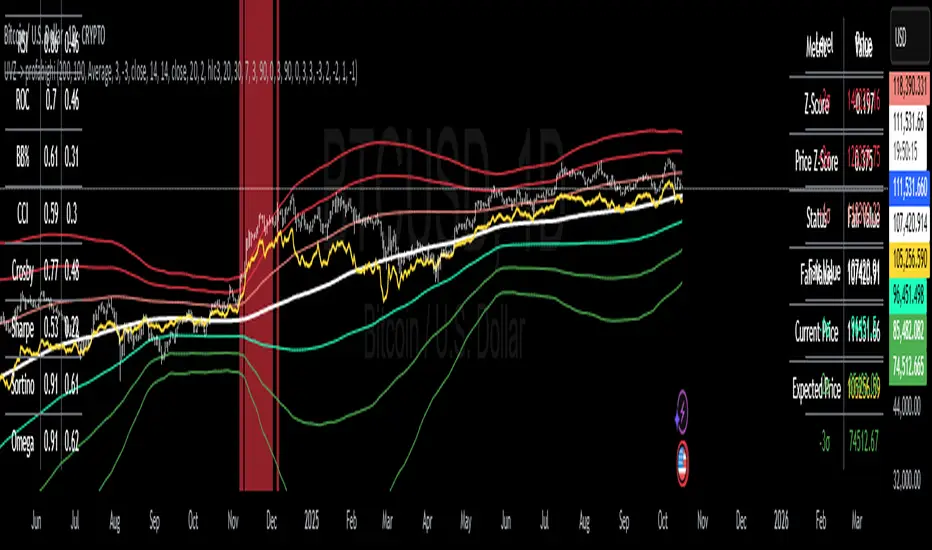
📋 Information Tables
Current Values Panel:
- Top-right summary of Z-score, price deviation, status, and fair value
- Color-codes entries matching the active Z-score zone
- Includes expected price projection for forward guidance
Correlation Matrix:
- Bottom-left grid showing indicator-price correlations and betas
- Rows for each metric with decimal precision for relationship strength
- Aids in understanding which signals drive valuation most
Price Levels Summary:
- Bottom-right ladder of Z-derived thresholds from -3 to +3 sigma
- Lists corresponding price levels for potential support/resistance
- Toggles with threshold display for integrated analysis
🔔 Alert System
- Overbought Crossover: Triggers when Z-score enters upper threshold zone
- Oversold Crossunder: Fires on Z-score dropping into lower threshold
- Price vs. Expectation Cross: Alerts on price diverging from indicator-derived target
- Extreme Wick Hits: Notifies when highs/lows breach far Z-boundaries
✅ Key Takeaways
- Holistic Valuation Tool: Blends multiple Z-scores for robust over/undervaluation signals
- Adaptive Intelligence: Correlation-weighted indicators prioritize price-relevant metrics
- Visual Simplicity: Color gradients, tables, and bars make complex analysis intuitive
- Customizable Depth: Toggle indicators and thresholds to fit any market or style
- Forward Projection: Expected prices guide targets beyond current fair value
- Risk-Aware Framework: Sharpe, Sortino, and Omega add efficiency layers to momentum
- Alert Precision: Zone crosses and wick extremes ensure timely notifications
สคริปต์แบบเฉพาะผู้ได้รับเชิญเท่านั้น
เฉพาะผู้ใช้ที่ได้รับการอนุมัติจากผู้เขียนเท่านั้นที่สามารถเข้าถึงสคริปต์นี้ได้ คุณจะต้องร้องขอและได้รับอนุญาตก่อนจึงจะสามารถใช้งานได้ โดยปกติจะได้รับอนุญาตหลังจากชำระเงินแล้ว สำหรับรายละเอียดเพิ่มเติม ทำตามคำแนะนำของผู้เขียนด้านล่างหรือติดต่อ PROFABIGHI_CAPITAL โดยตรง
TradingView ไม่แนะนำให้ชำระเงินหรือใช้สคริปต์ เว้นแต่ว่าคุณจะเชื่อถือผู้เขียนสคริปต์และเข้าใจวิธีการทำงานของมัน คุณยังอาจพบทางเลือกของโอเพนซอร์ส แบบฟรีในสคริปต์ชุมชนของเรา
คำแนะนำของผู้เขียน
คำจำกัดสิทธิ์ความรับผิดชอบ
สคริปต์แบบเฉพาะผู้ได้รับเชิญเท่านั้น
เฉพาะผู้ใช้ที่ได้รับการอนุมัติจากผู้เขียนเท่านั้นที่สามารถเข้าถึงสคริปต์นี้ได้ คุณจะต้องร้องขอและได้รับอนุญาตก่อนจึงจะสามารถใช้งานได้ โดยปกติจะได้รับอนุญาตหลังจากชำระเงินแล้ว สำหรับรายละเอียดเพิ่มเติม ทำตามคำแนะนำของผู้เขียนด้านล่างหรือติดต่อ PROFABIGHI_CAPITAL โดยตรง
TradingView ไม่แนะนำให้ชำระเงินหรือใช้สคริปต์ เว้นแต่ว่าคุณจะเชื่อถือผู้เขียนสคริปต์และเข้าใจวิธีการทำงานของมัน คุณยังอาจพบทางเลือกของโอเพนซอร์ส แบบฟรีในสคริปต์ชุมชนของเรา